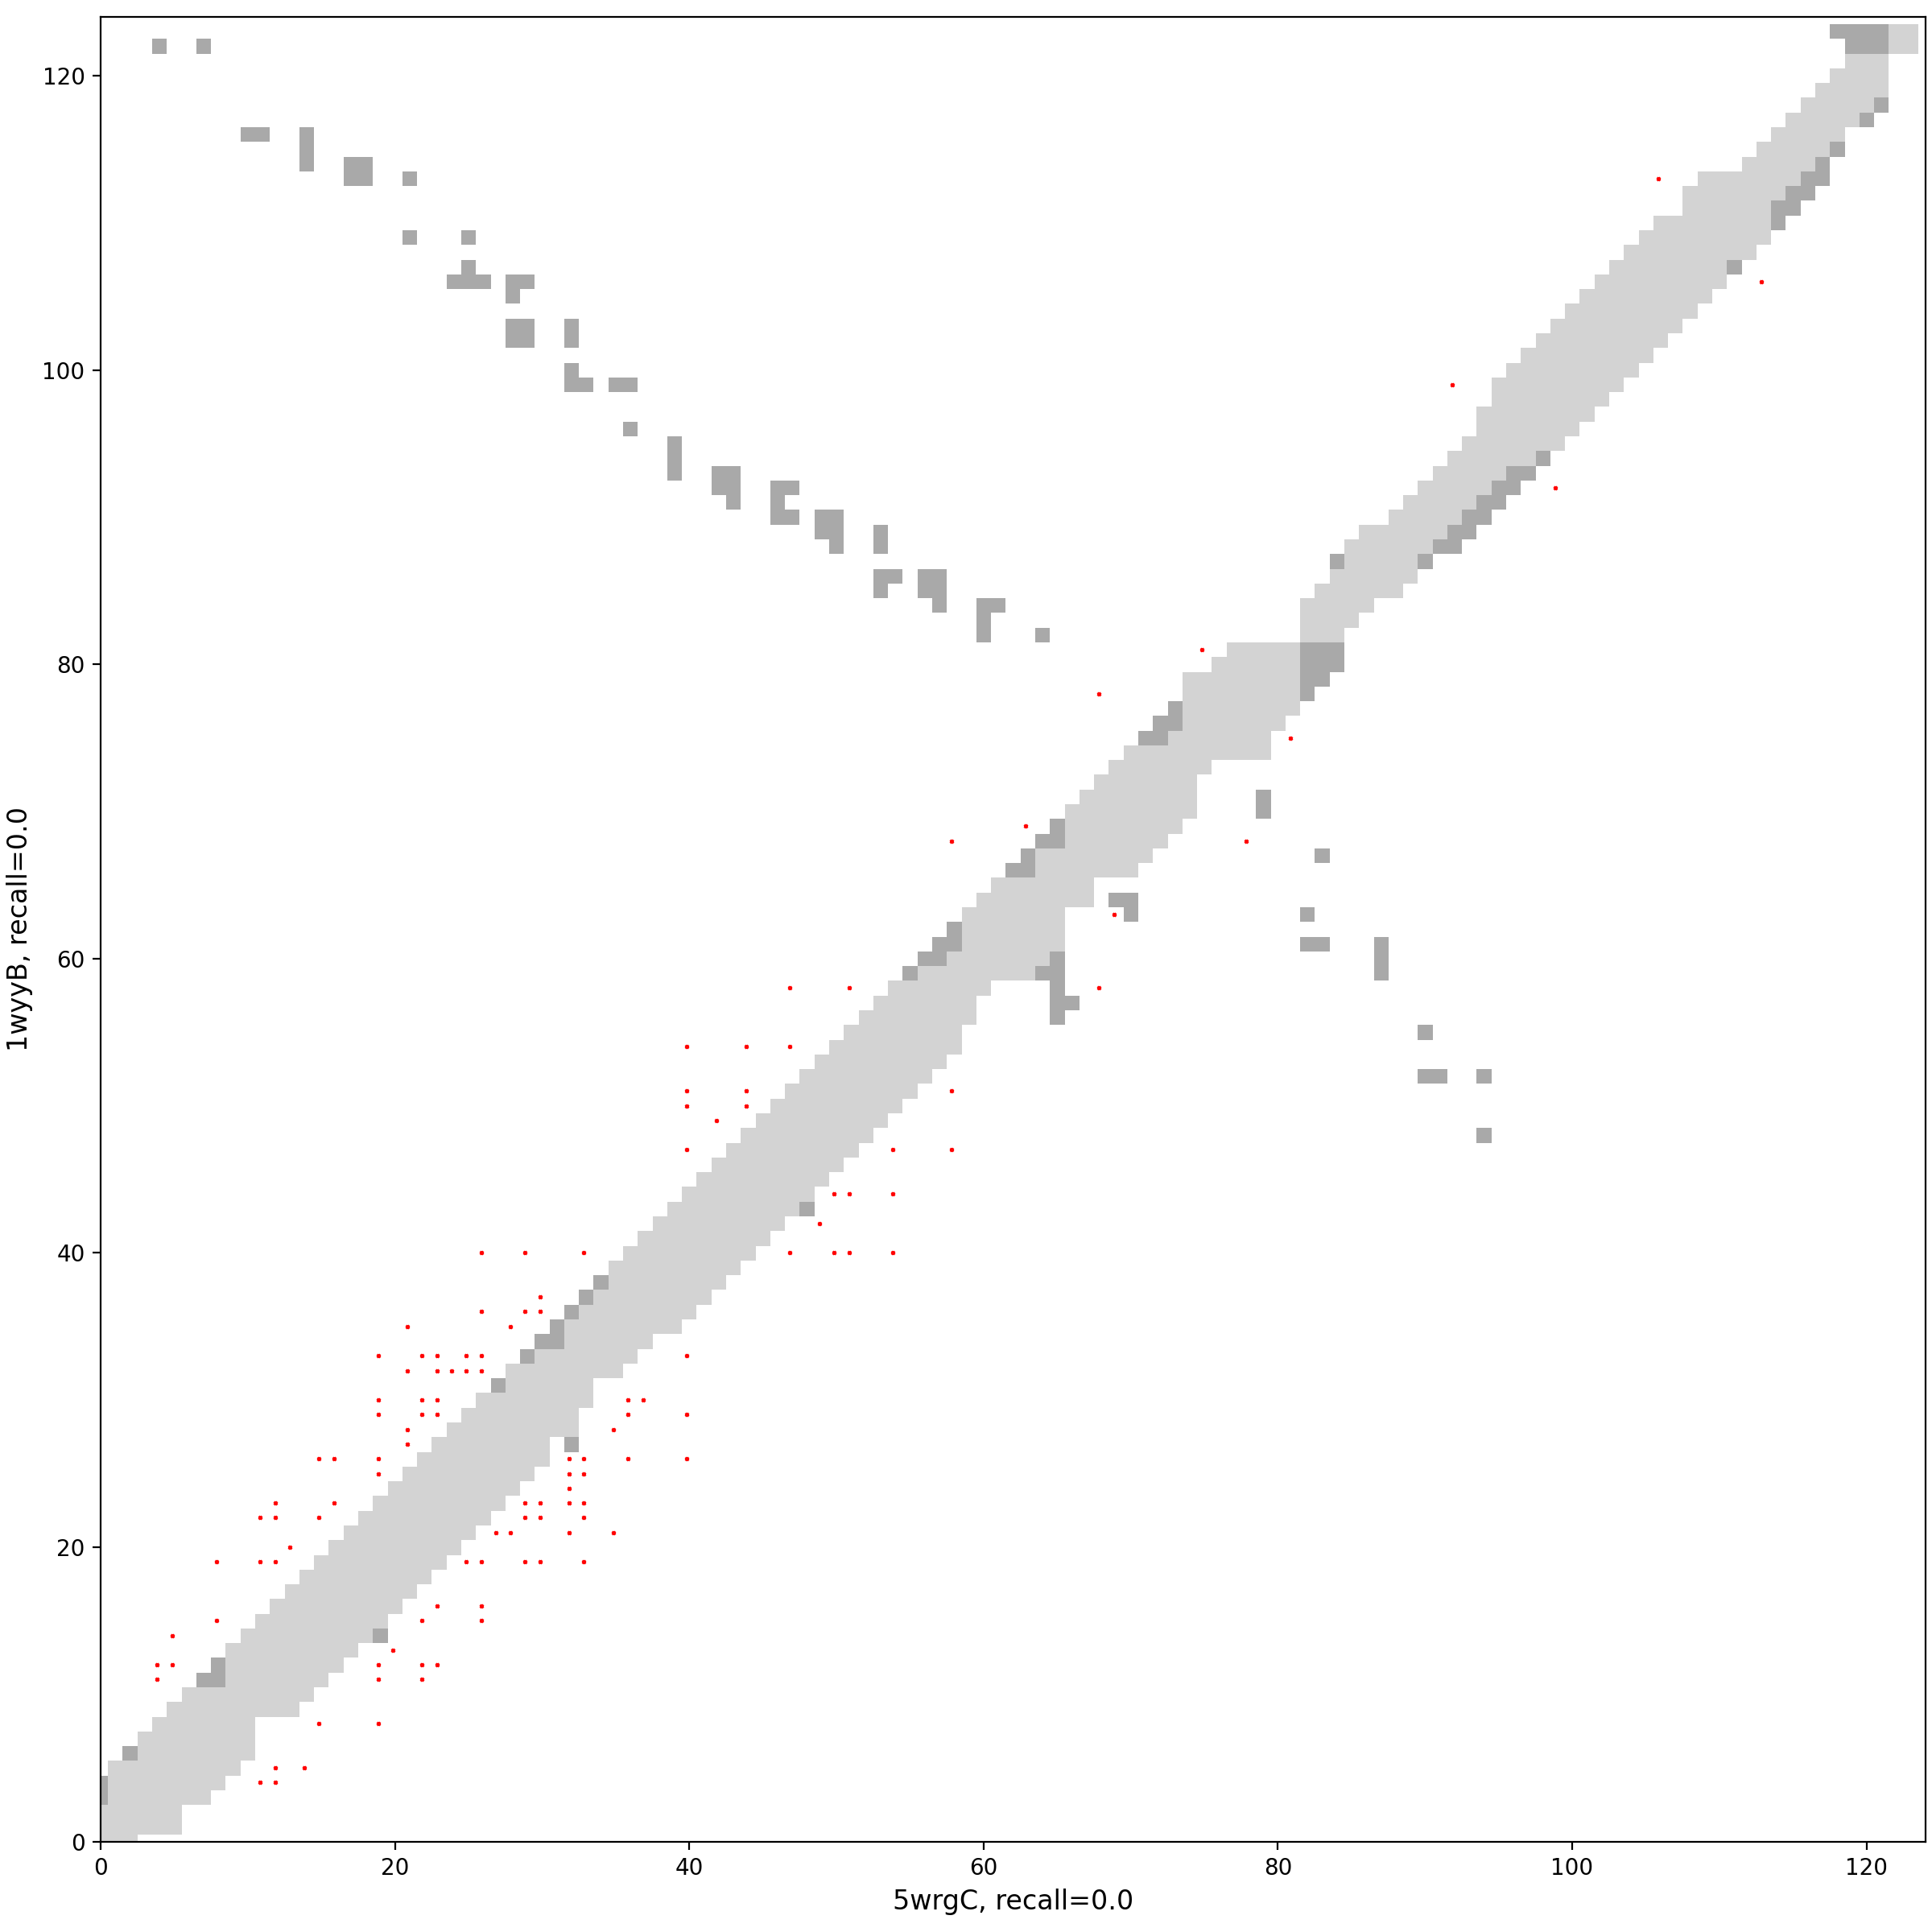
Analysis of pair 5wrgC_1wyyB
5wrgC vs 1wyyB
Missing: Fold1 vs best AF2
Missing: Fold2 vs best AF2
Missing: Fold1 vs best AF3
Missing: Fold2 vs best AF3
Missing: Fold1 vs best ESM2
Missing: Fold2 vs best ESM2
Missing: Fold1 vs best ESM3
Missing: Fold2 vs best ESM3
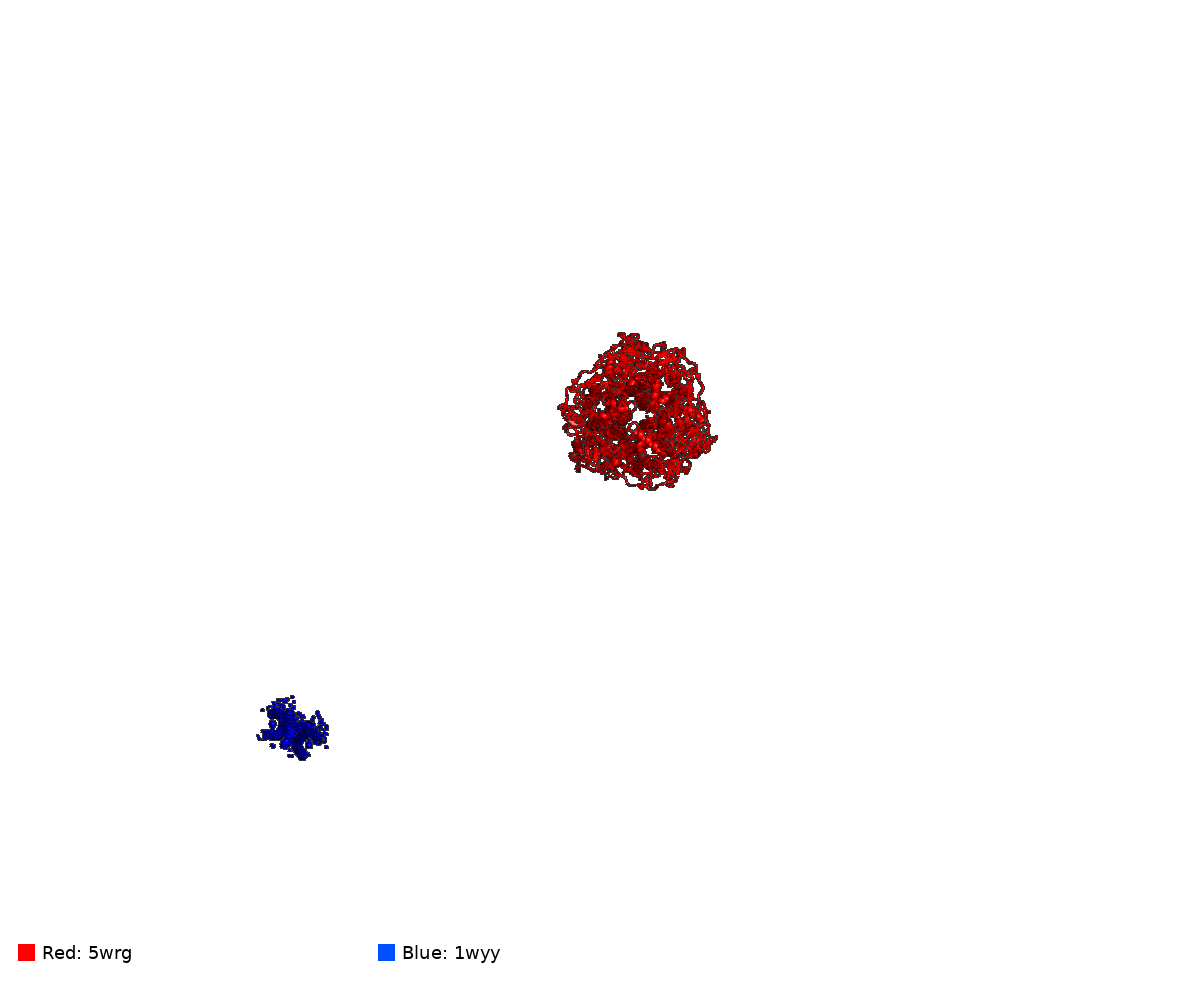
[missing] 5wrgC vs. 1wyyB (unaligned) — interactive
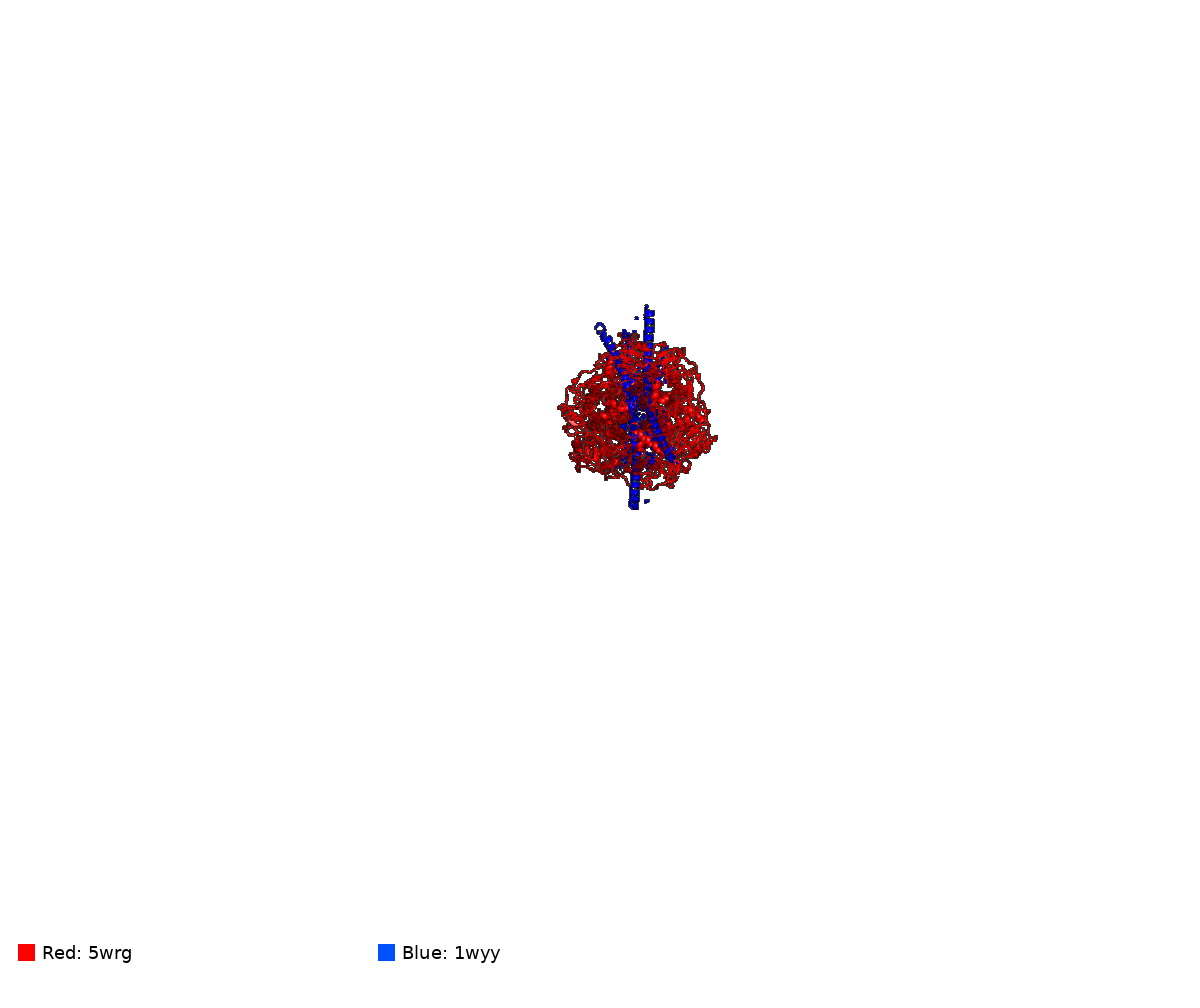
[missing] 5wrgC vs. 1wyyB (aligned) — interactive
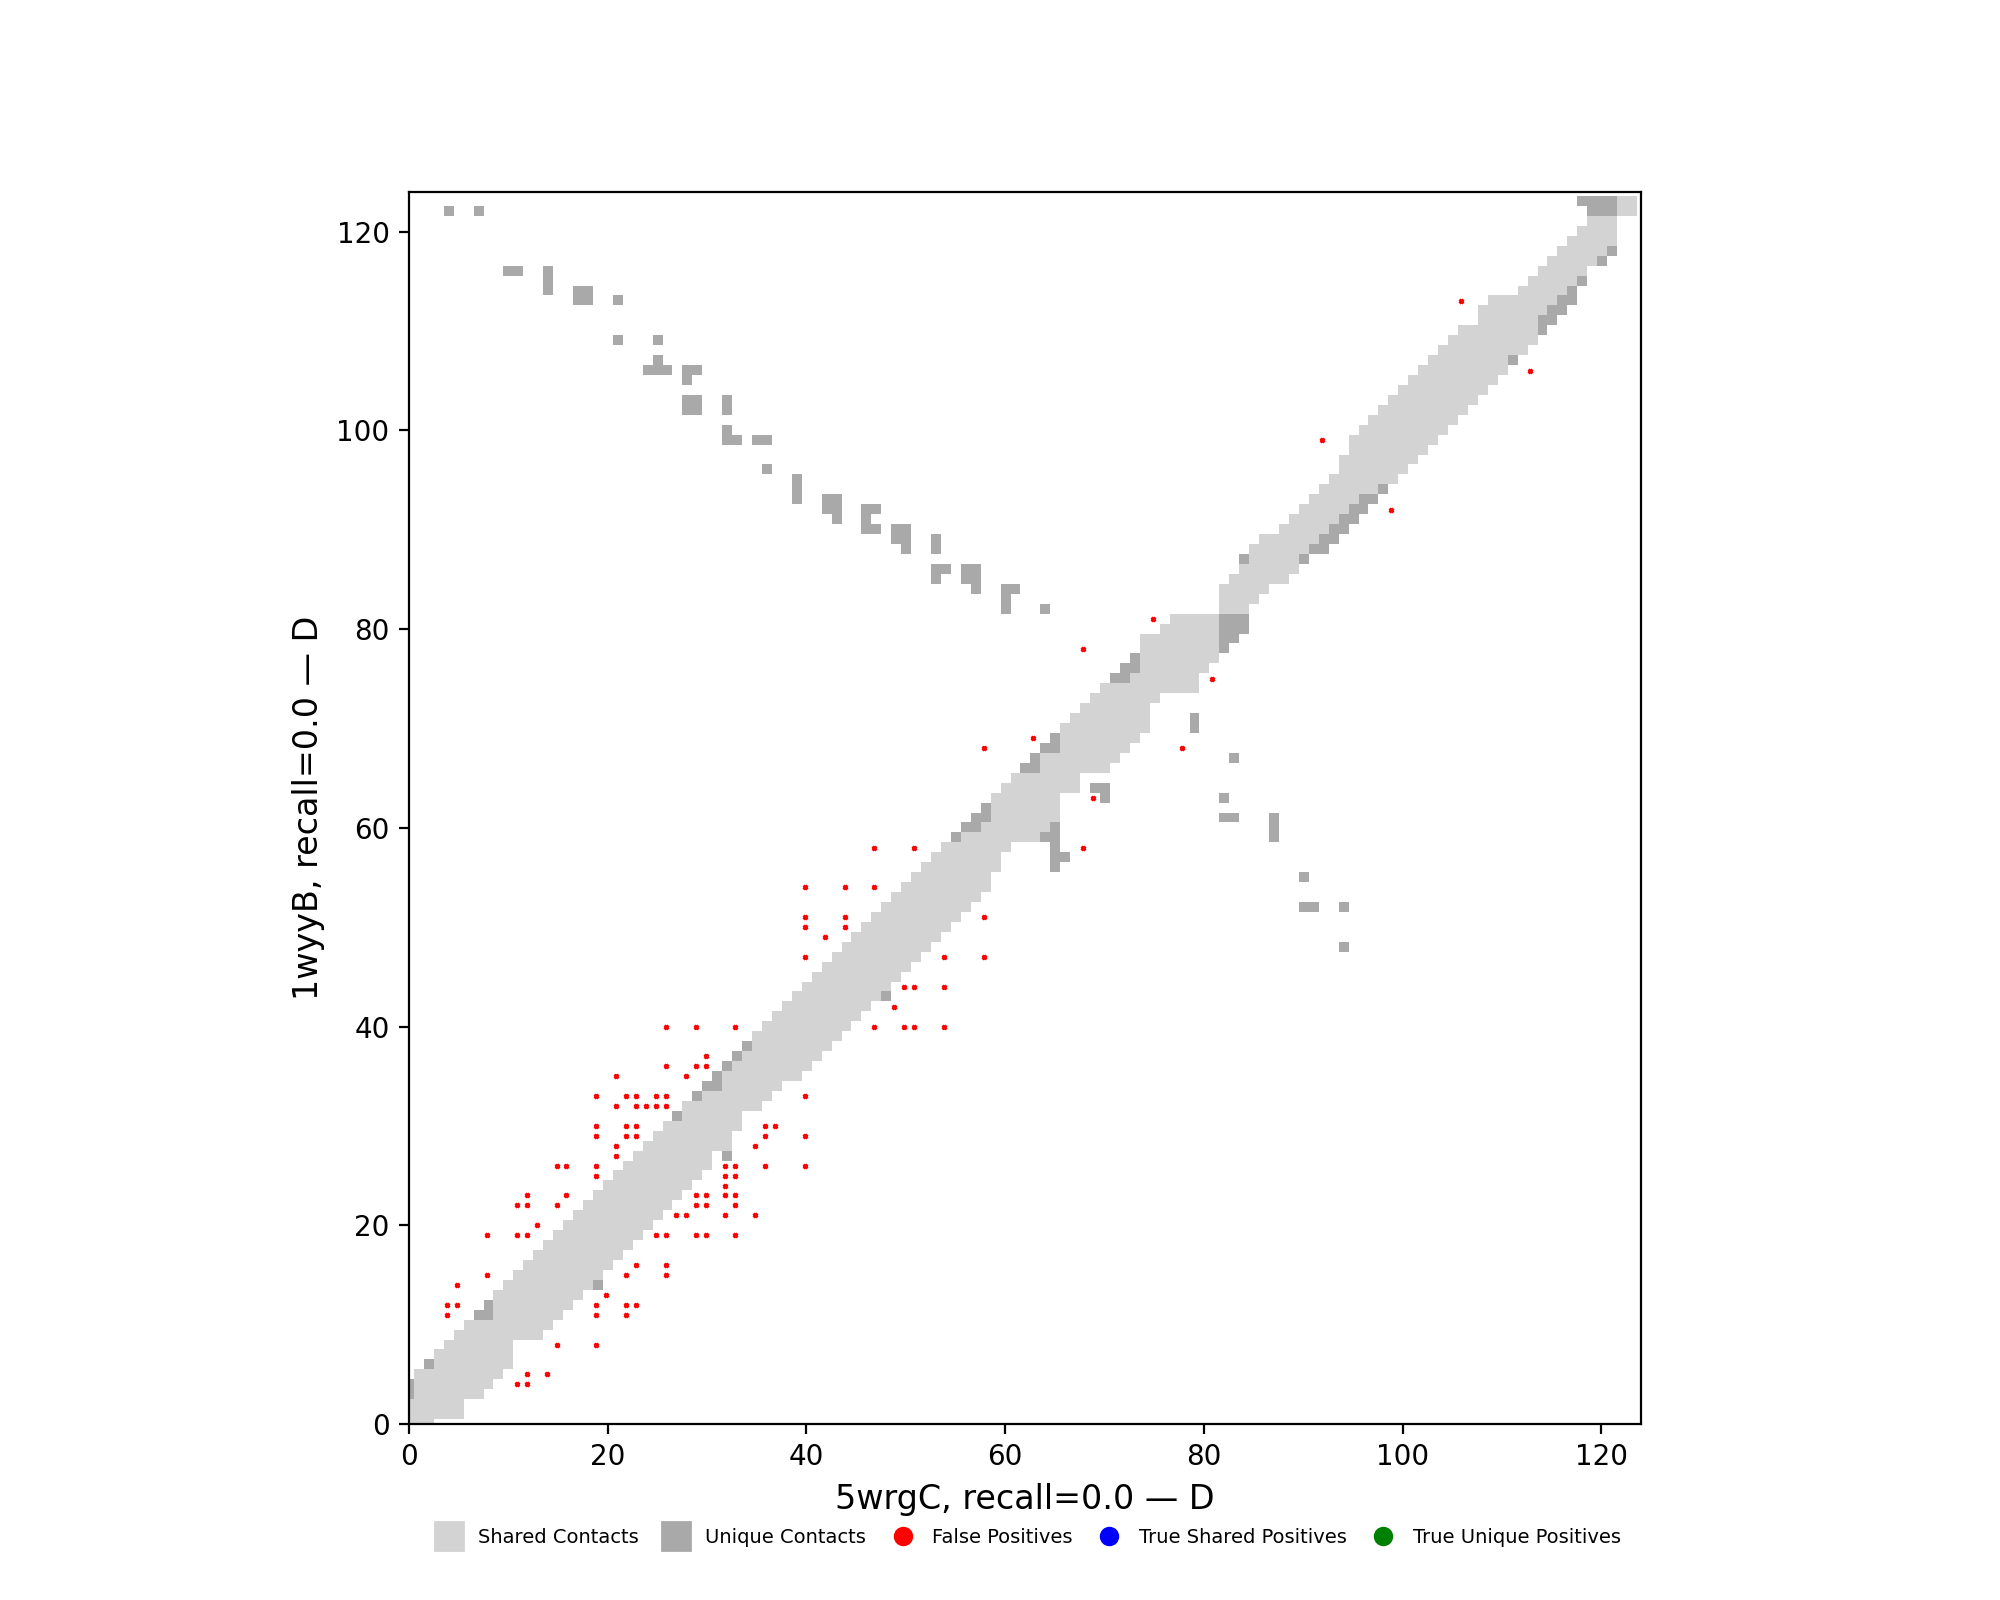
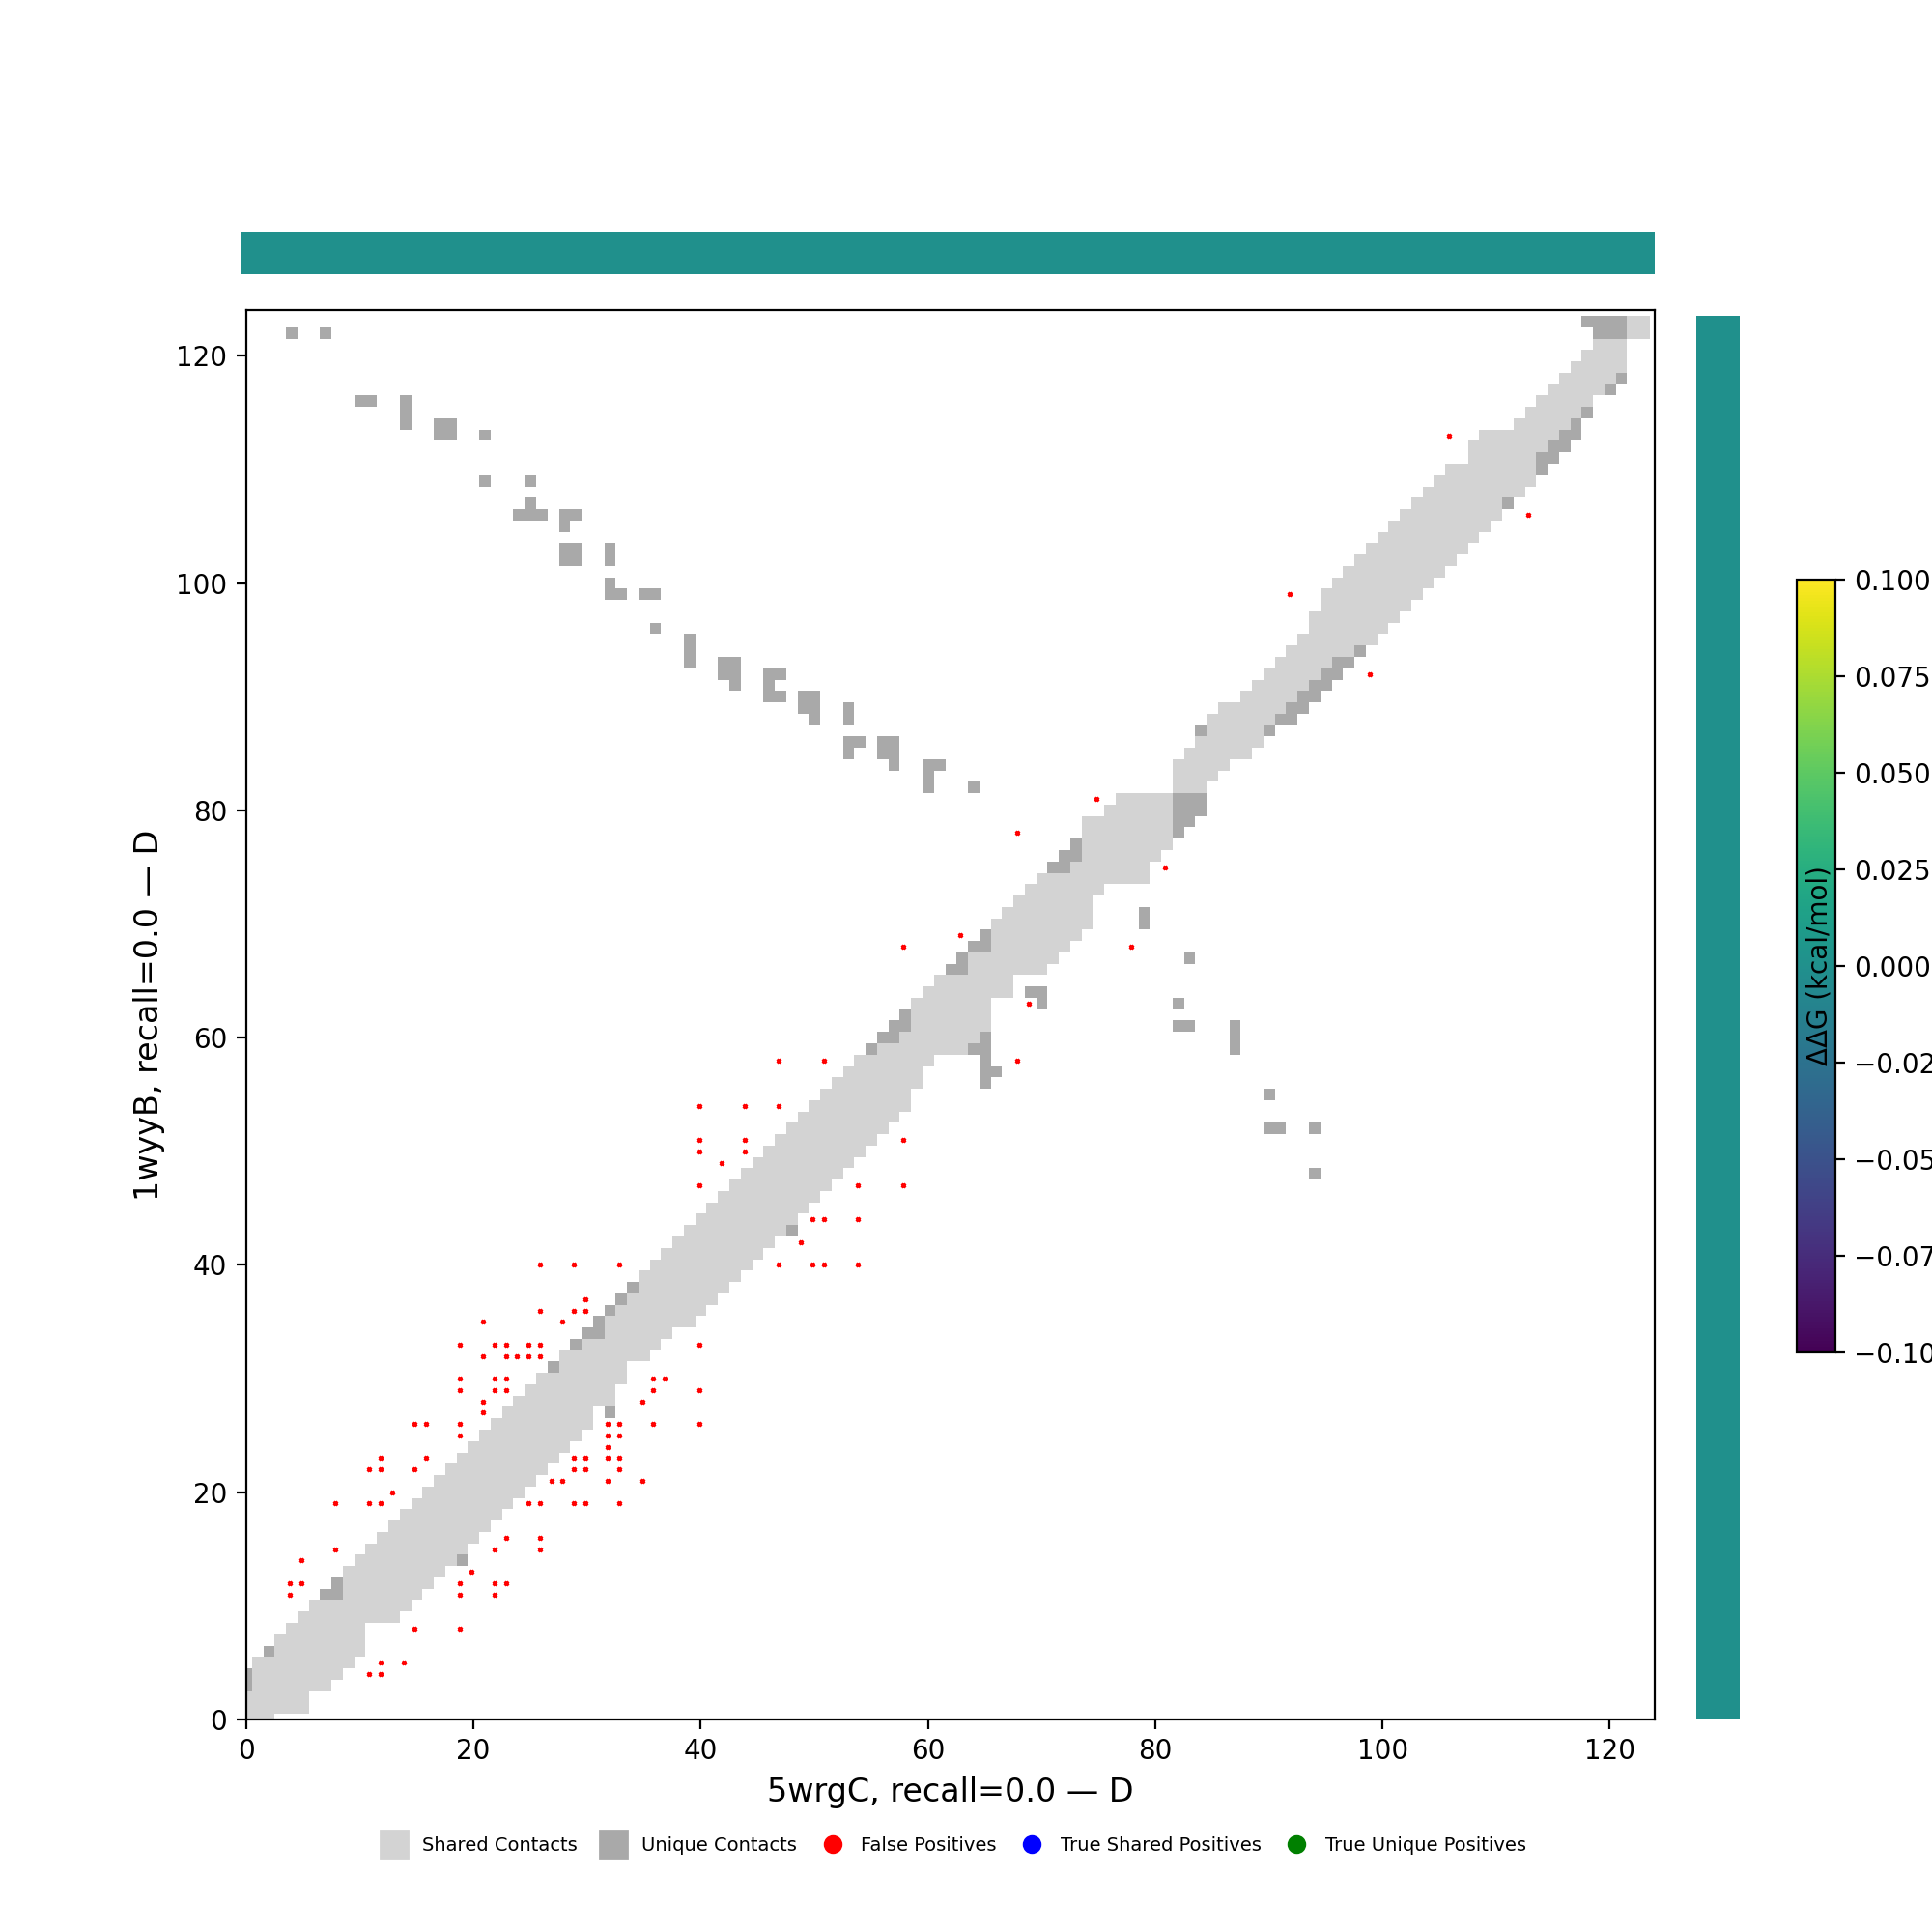
Per-cluster contact maps
Cluster metrics table
| cluster | n | neff | AF2_TM1 | AF2_TM2 | AF3_TM1 | AF3_TM2 | RE-MSAT-COM | RE-MSAT1 | RE-MSAT2 | ESM_SEQIDS | ESM_TM1_LIST | ESM_TM2_LIST |
|---|
| Deep | - | - | 0.48 | 0.62 | 0.34 | 0.71 | 0.0 | 0.08 | 0.0 | - | - | - |
| 000 | - | - | 0.38 | 0.63 | 0.32 | 0.62 | 0.0 | 0.01 | 0.0 | 006; 006; 005; 005; 008; 008; 007; 007; 001; 003 | 0.30; 0.30; 0.25; 0.24; 0.23; 0.22; 0.21; 0.20; 0.18; 0.18 | 0.37; 0.37; 0.41; 0.42; 0.48; 0.48; 0.47; 0.47; 0.60; 0.61 |
| 001 | - | - | 0.47 | 0.62 | 0.37 | 0.63 | 0.0 | 0.08 | 0.0 | 008; 008; 004; 004; 001; 007; 007; 005; 001; 005 | 0.24; 0.24; 0.23; 0.23; 0.22; 0.22; 0.22; 0.21; 0.21; 0.21 | 0.43; 0.43; 0.37; 0.37; 0.64; 0.36; 0.36; 0.43; 0.63; 0.43 |