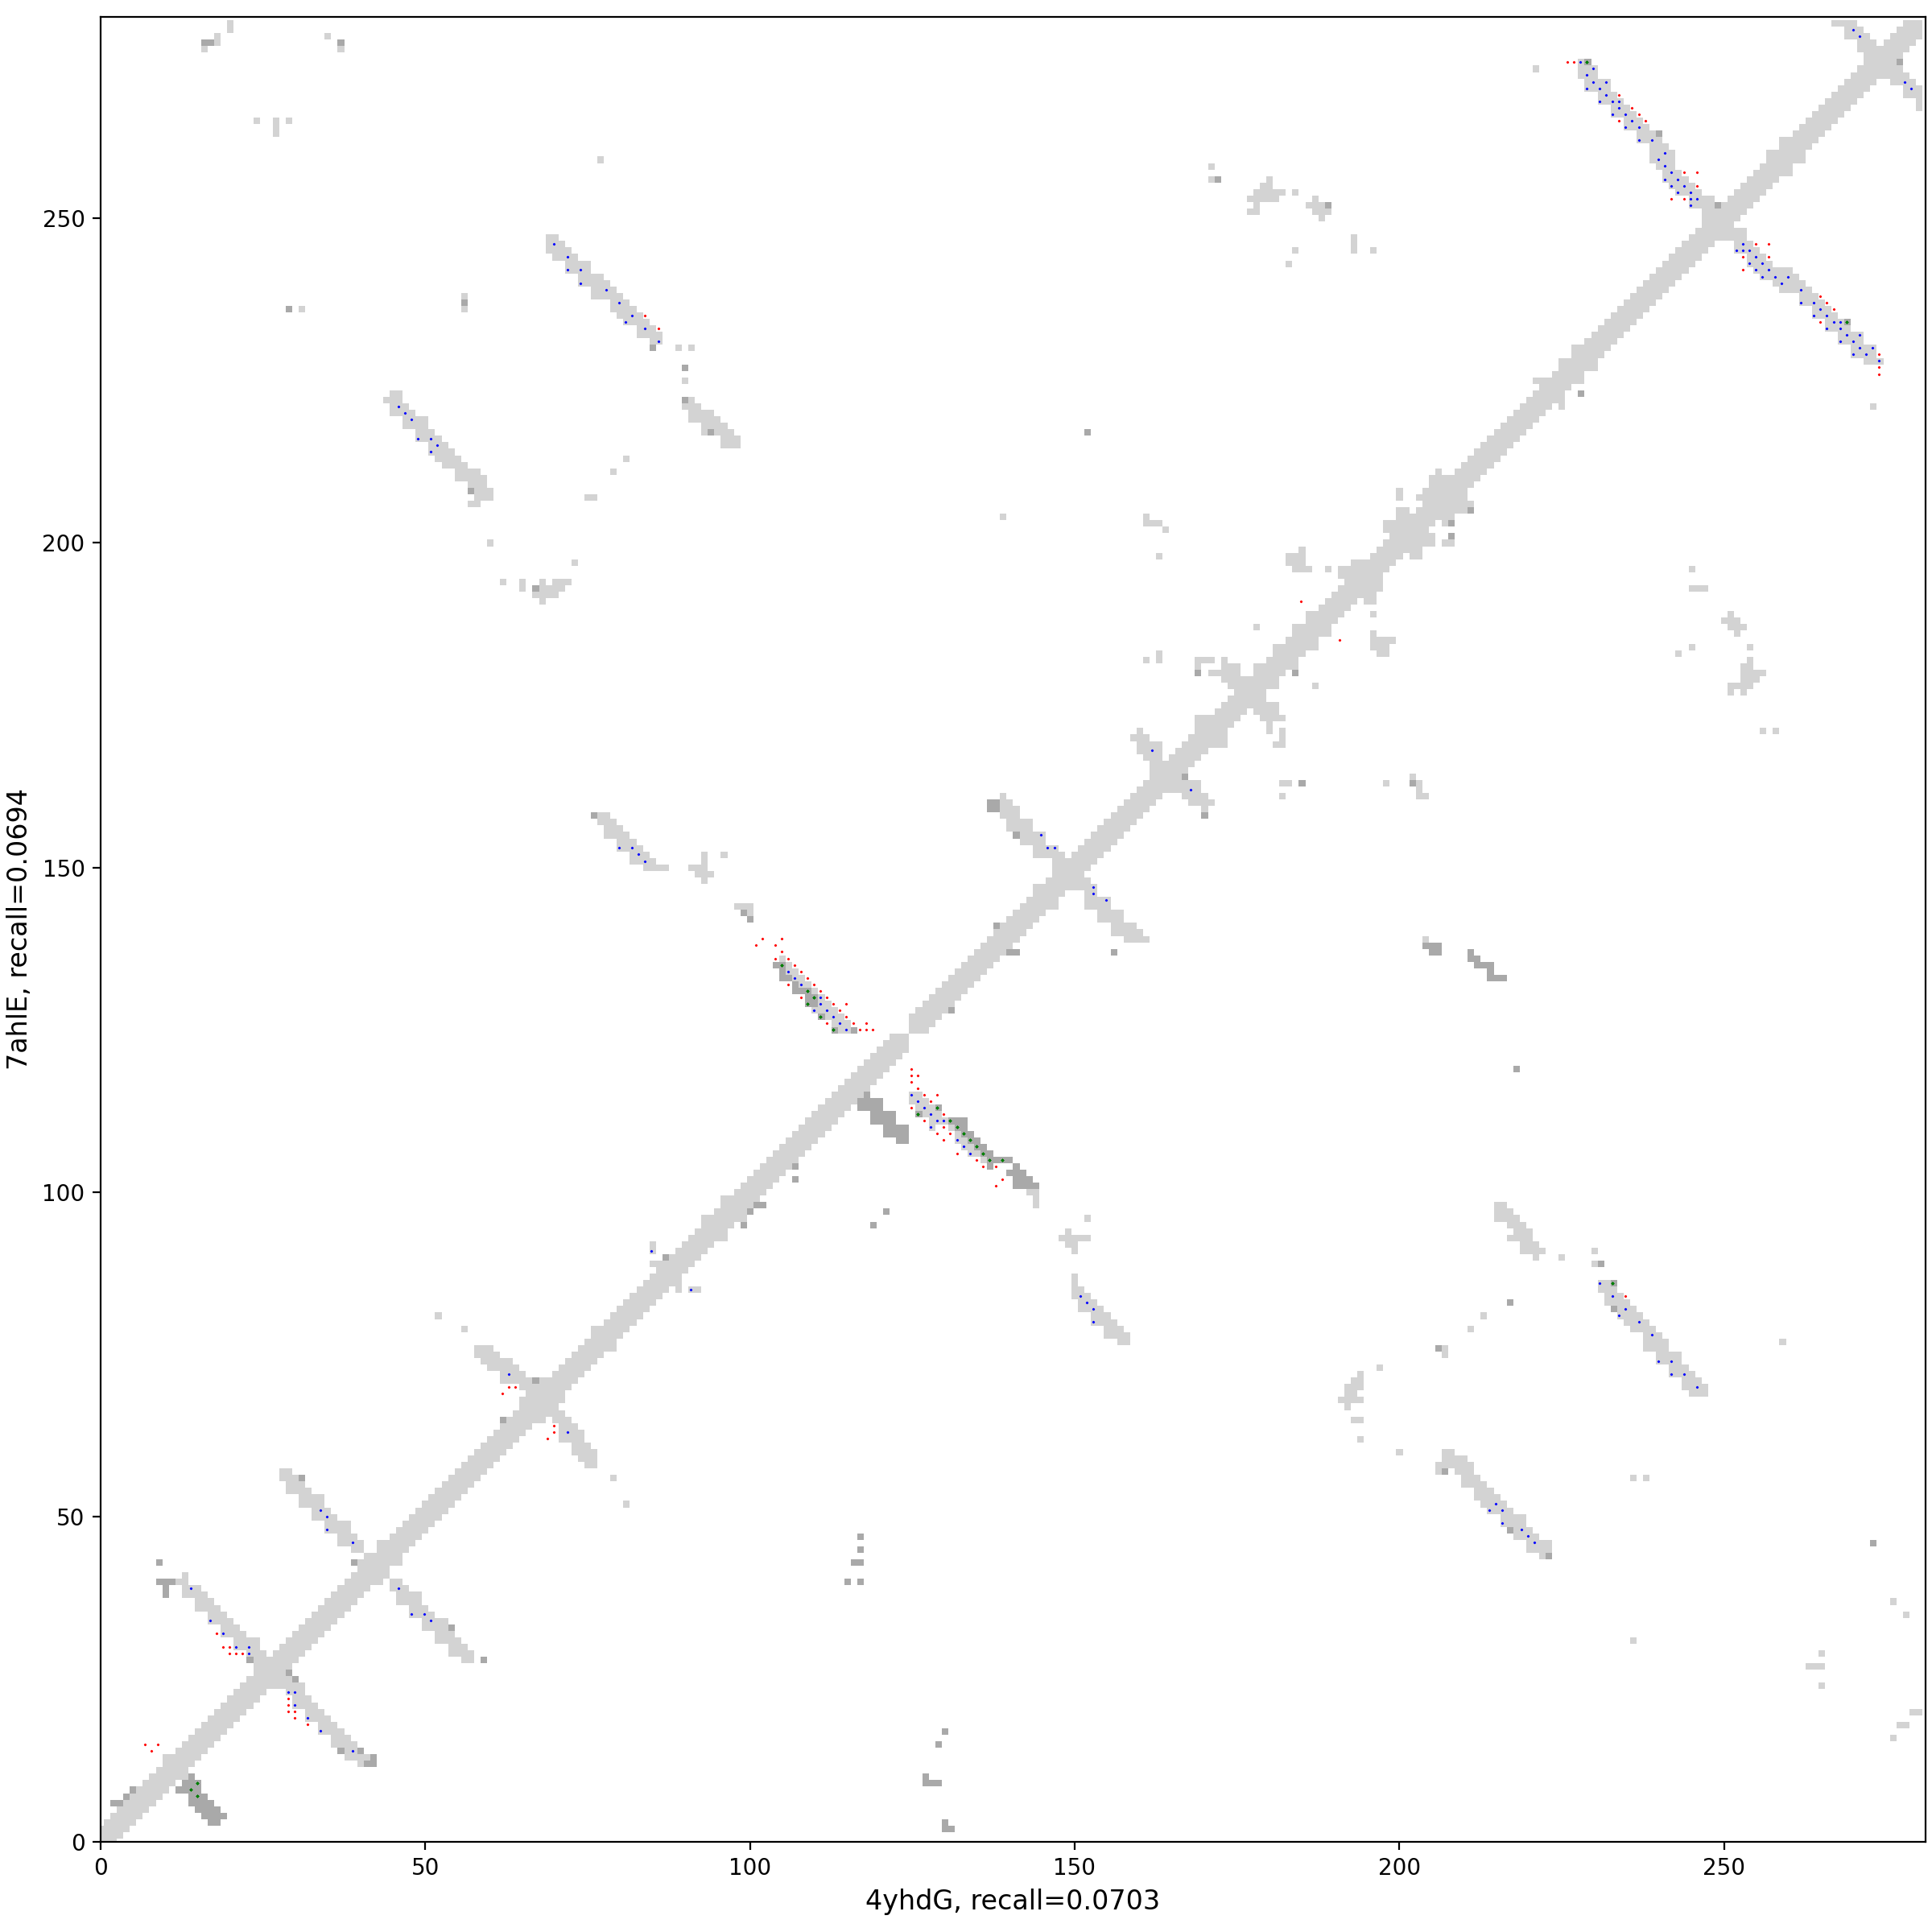
Analysis of pair 4yhdG_7ahlE
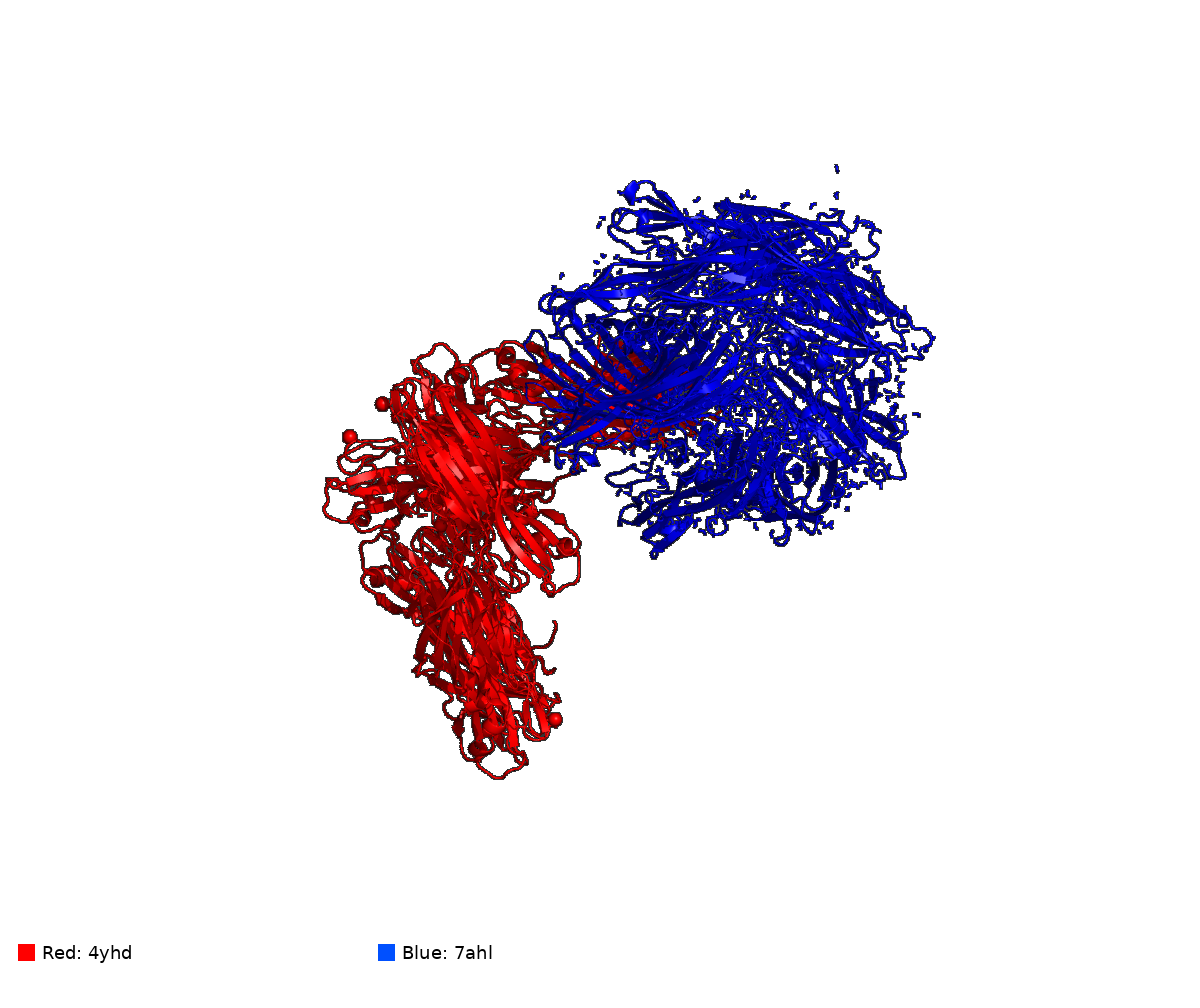
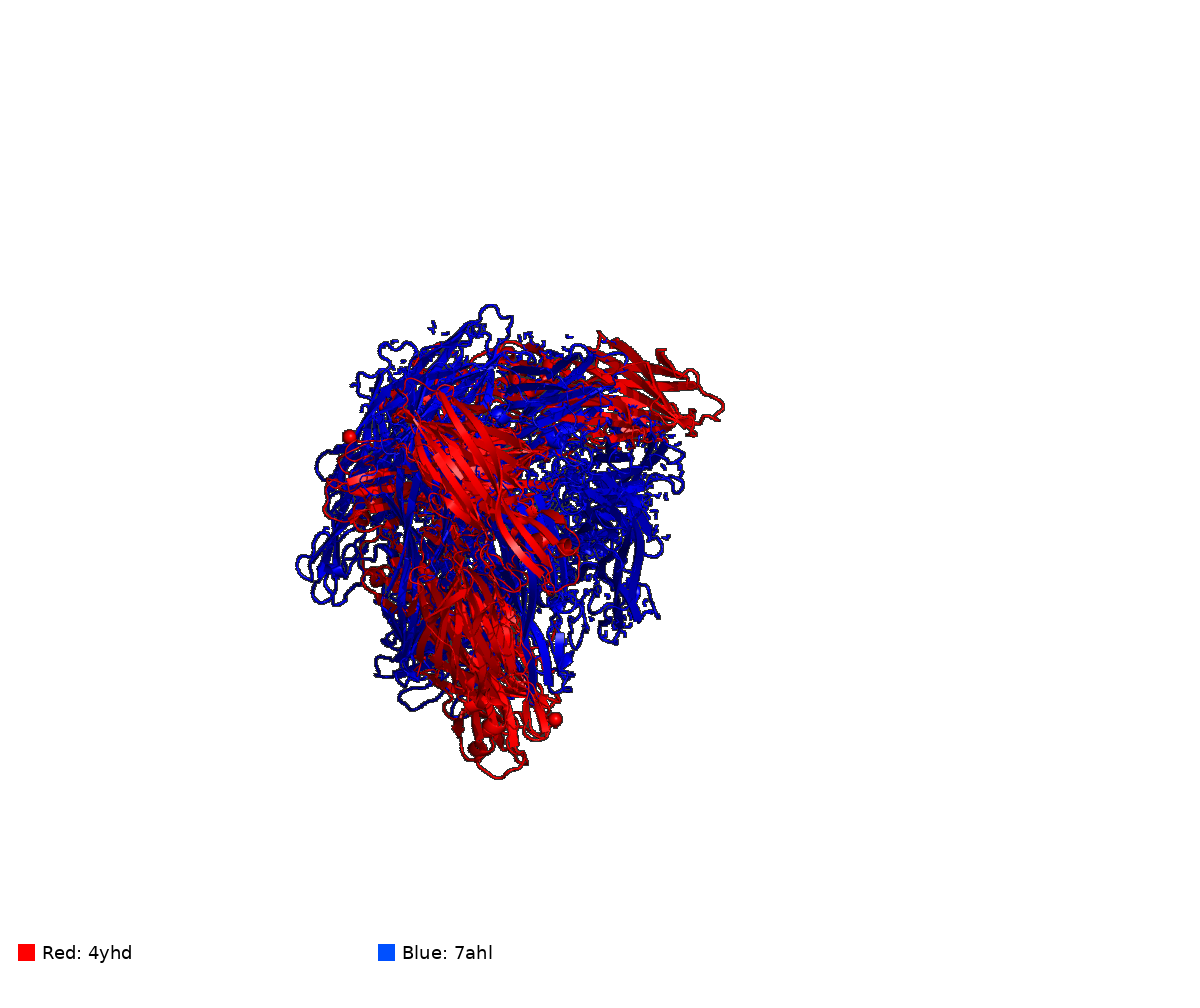
4yhdG vs 7ahlE
Missing: Fold1 vs best AF2
Missing: Fold2 vs best AF2
Missing: Fold1 vs best AF3
Missing: Fold2 vs best AF3
Missing: Fold1 vs best ESM2
Missing: Fold2 vs best ESM2
Missing: Fold1 vs best ESM3
Missing: Fold2 vs best ESM3
[missing] 4yhdG vs. 7ahlE (unaligned) — interactive
[missing] 4yhdG vs. 7ahlE (aligned) — interactive
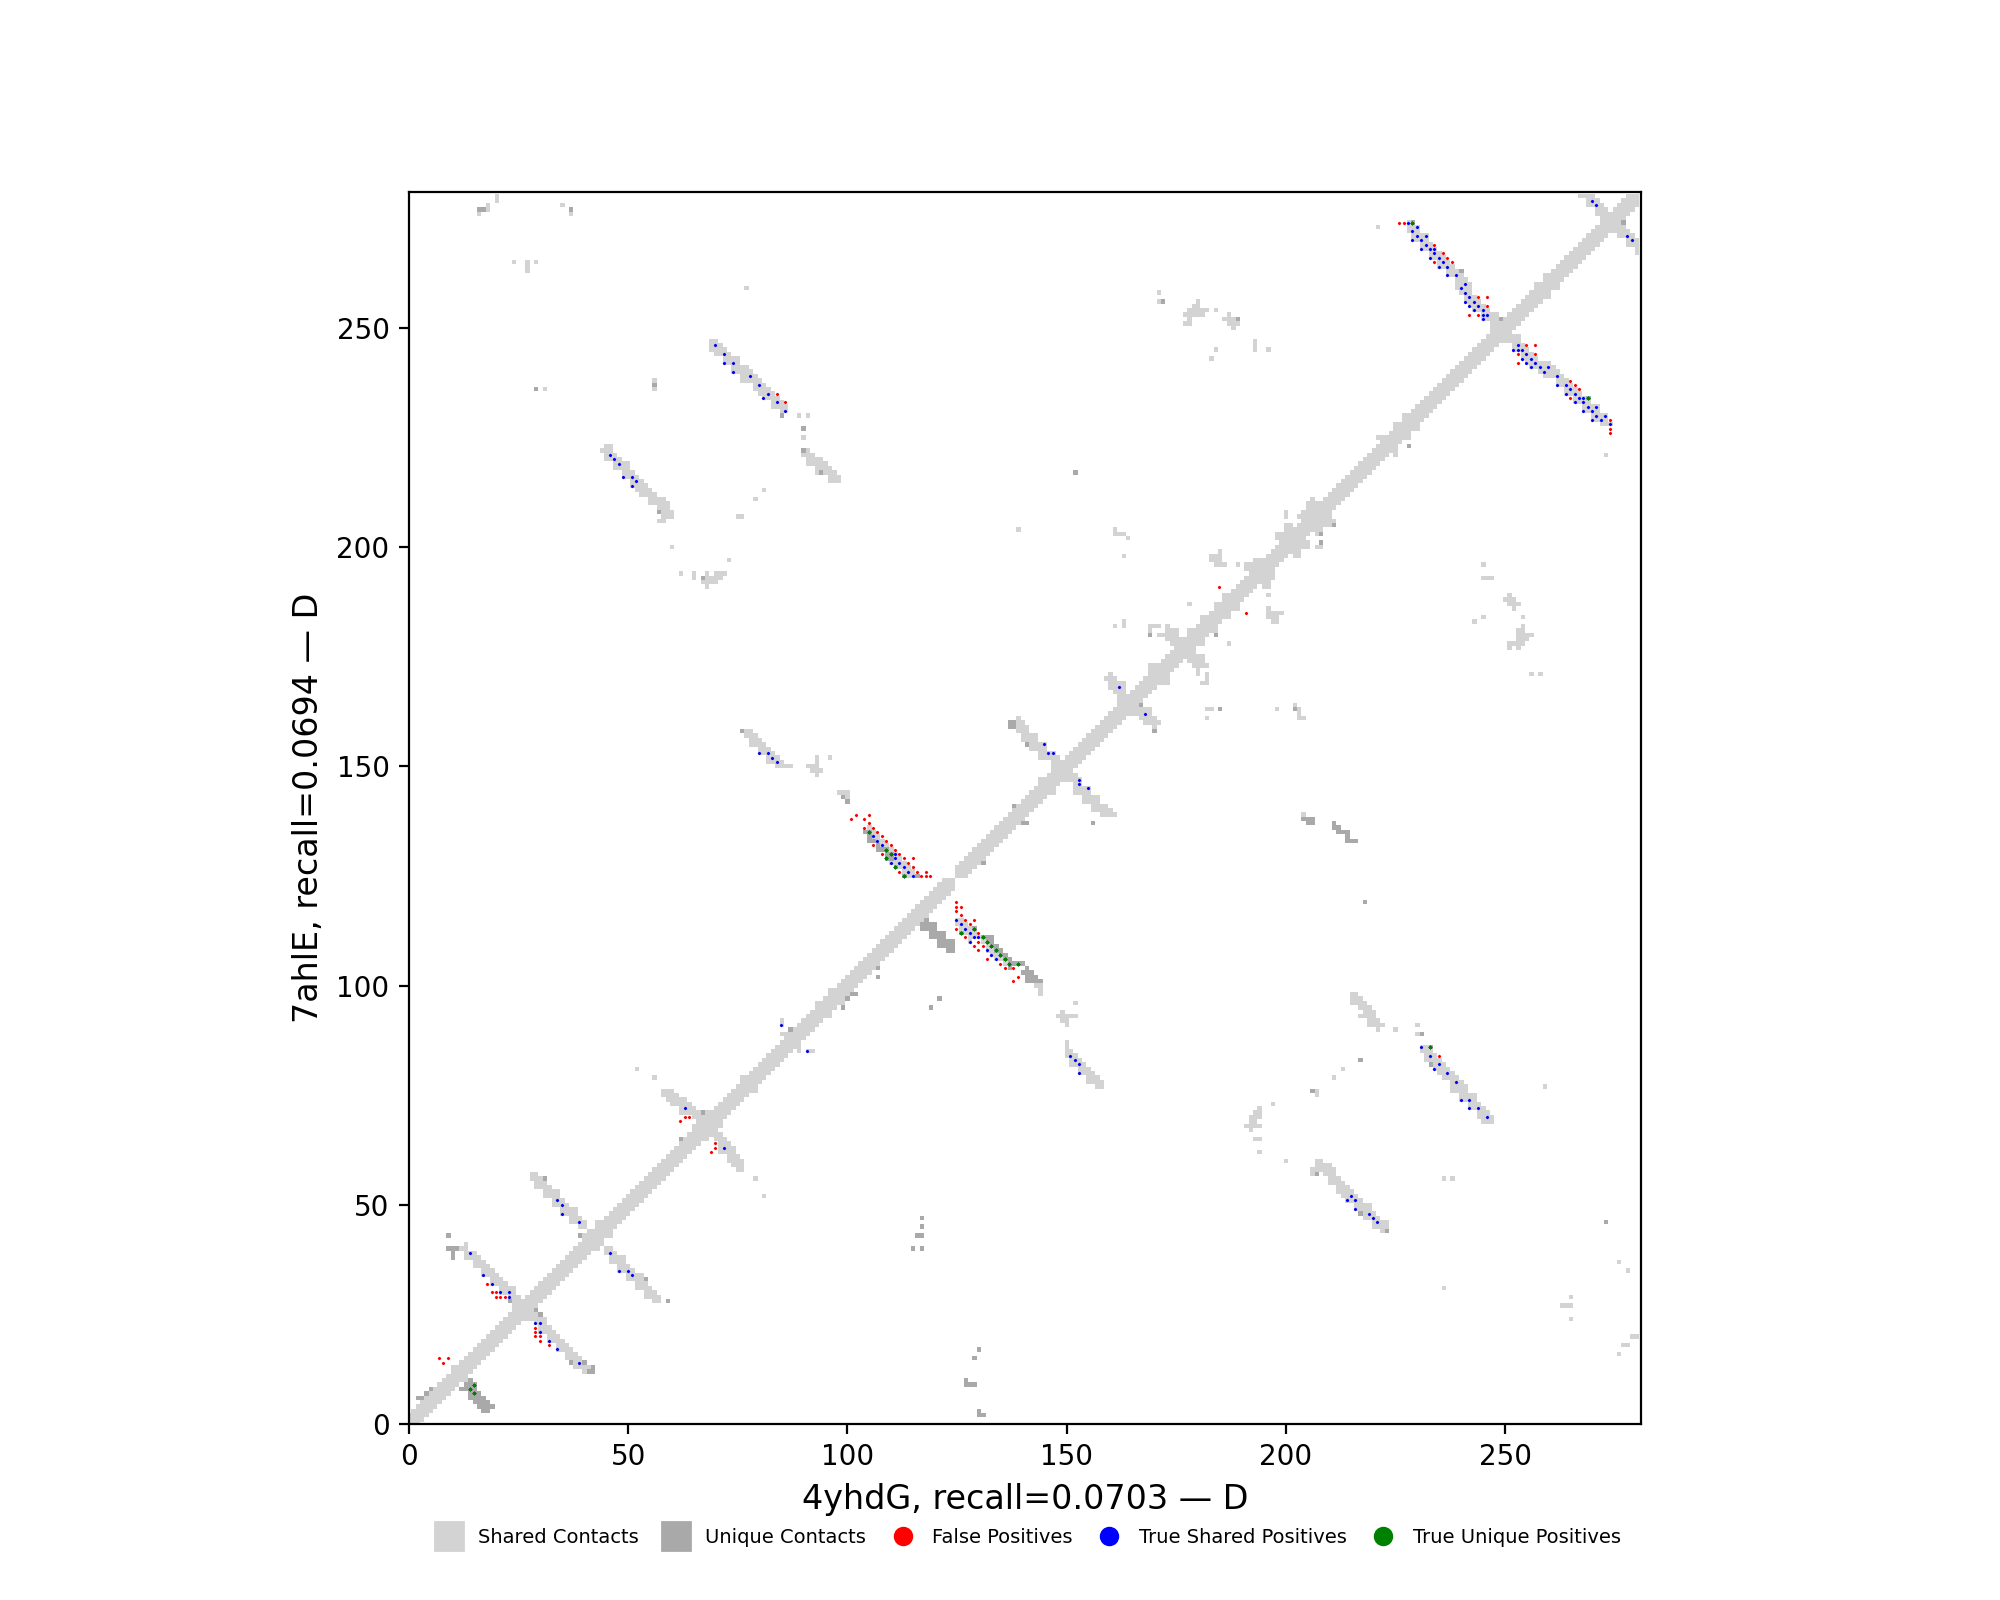
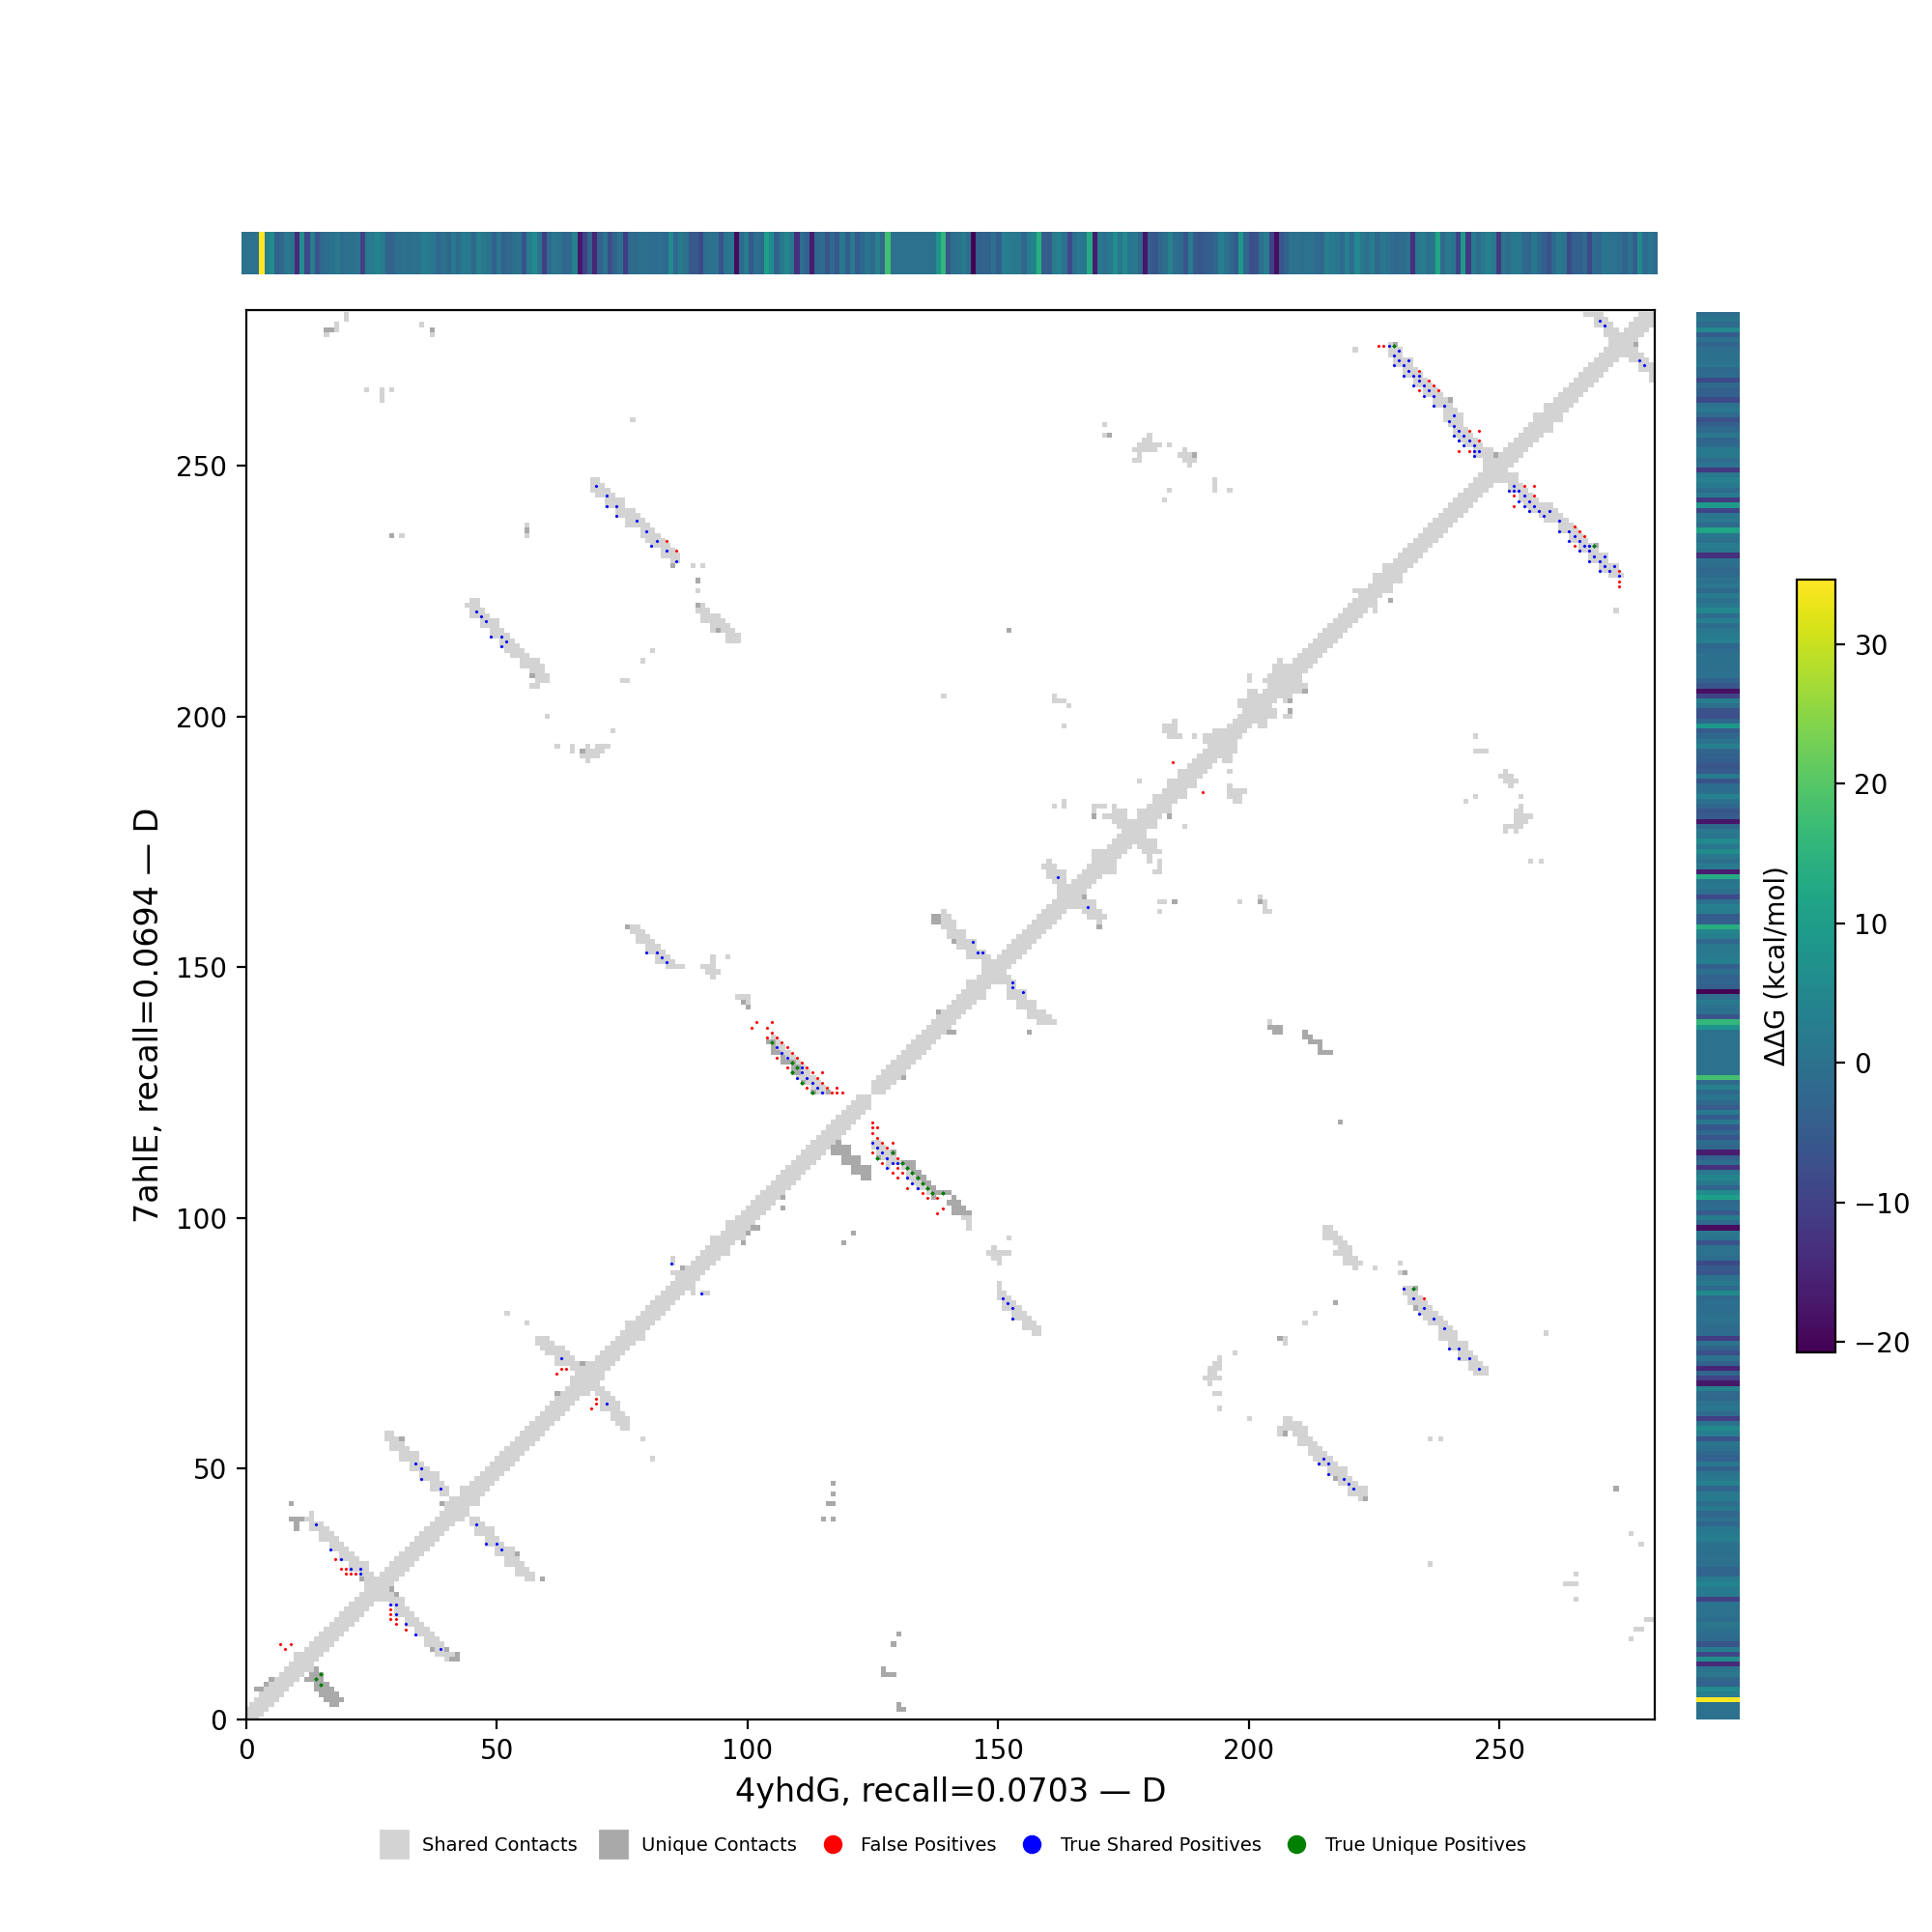
Per-cluster contact maps
Cluster metrics table
| cluster | n | neff | AF2_TM1 | AF2_TM2 | AF3_TM1 | AF3_TM2 | RE-MSAT-COM | RE-MSAT1 | RE-MSAT2 | ESM_SEQIDS | ESM_TM1_LIST | ESM_TM2_LIST |
|---|
| Deep | - | - | 0.96 | 0.78 | 0.98 | 0.79 | 0.29 | 0.29 | 0.32 | - | - | - |
| 000 | - | - | 0.96 | 0.78 | 0.99 | 0.79 | 0.2 | 0.2 | 0.23 | 002; 002; 001; 001; 010; 004; 004; 009; 003; 003 | 0.86; 0.86; 0.82; 0.82; 0.79; 0.79; 0.79; 0.78; 0.78; 0.78 | 0.71; 0.71; 0.68; 0.69; 0.68; 0.66; 0.66; 0.70; 0.68; 0.68 |
| 001 | - | - | 0.7 | 0.6 | 0.71 | 0.59 | 0.0 | 0.0 | 0.02 | 003; 003; 005; 008; 008; 005; 009; 009; 001; 001 | 0.84; 0.84; 0.81; 0.80; 0.80; 0.79; 0.78; 0.77; 0.75; 0.74 | 0.69; 0.69; 0.69; 0.69; 0.69; 0.70; 0.70; 0.70; 0.65; 0.65 |