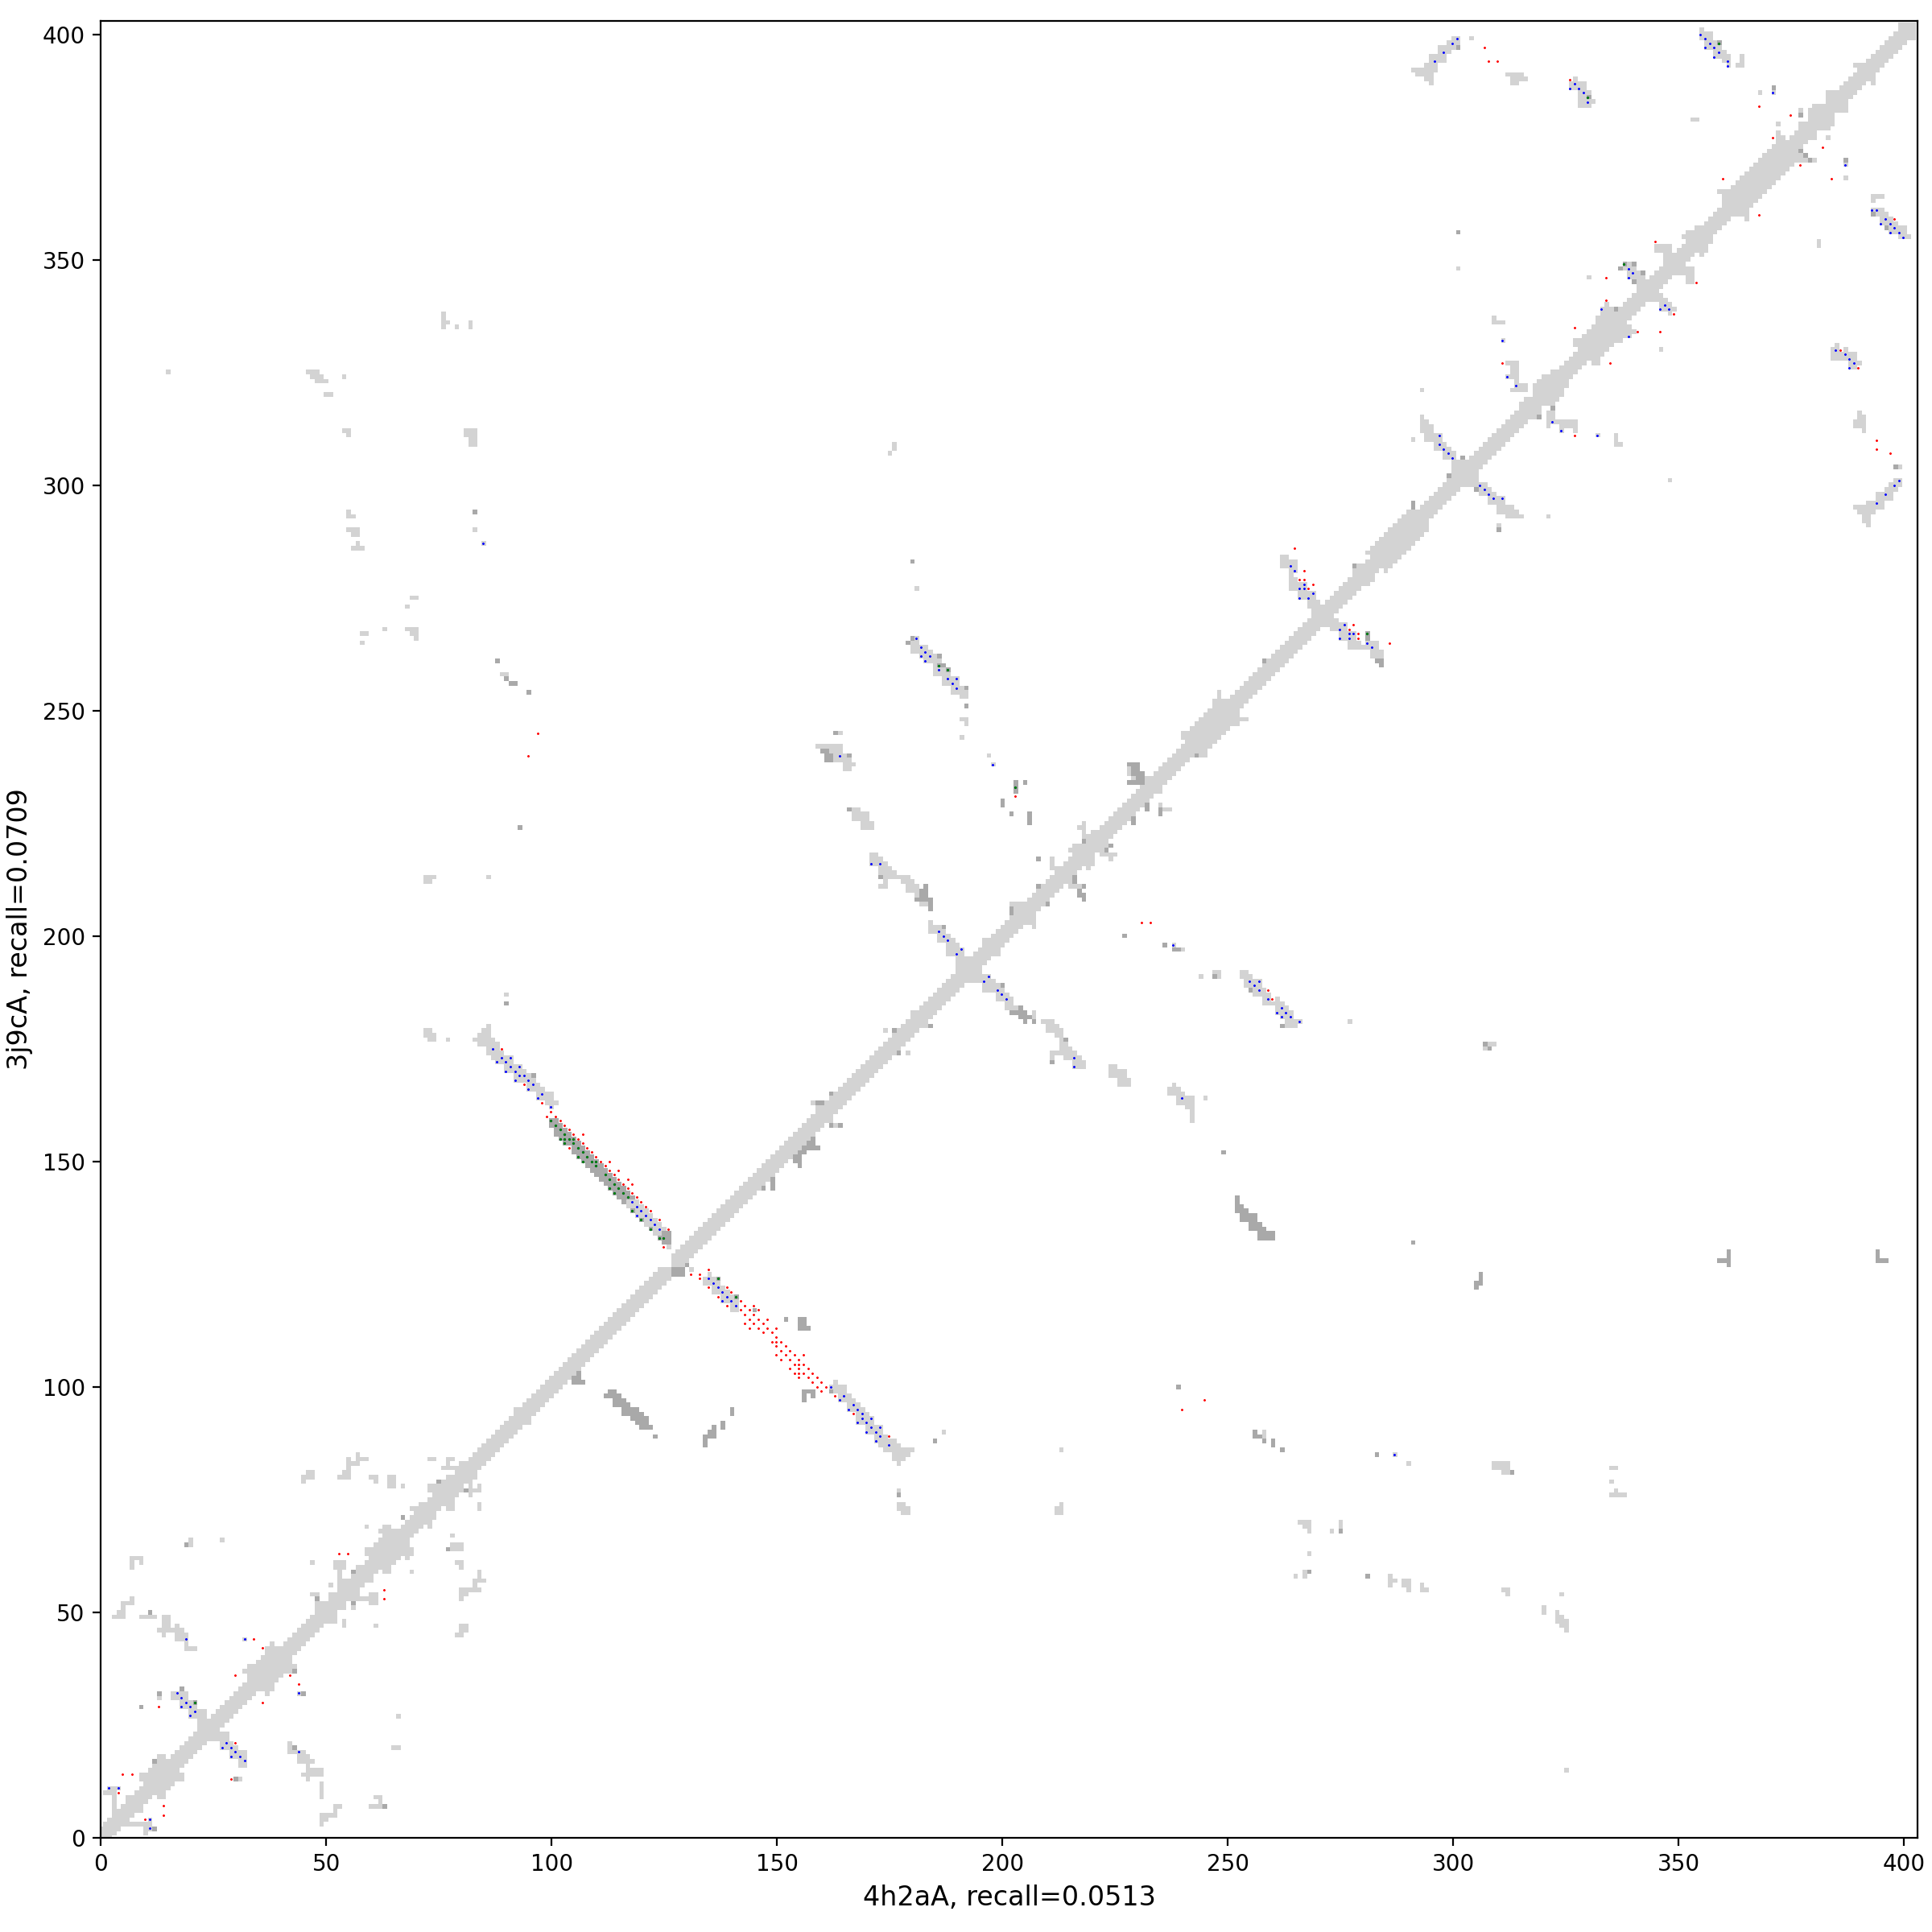
Analysis of pair 4h2aA_3j9cA
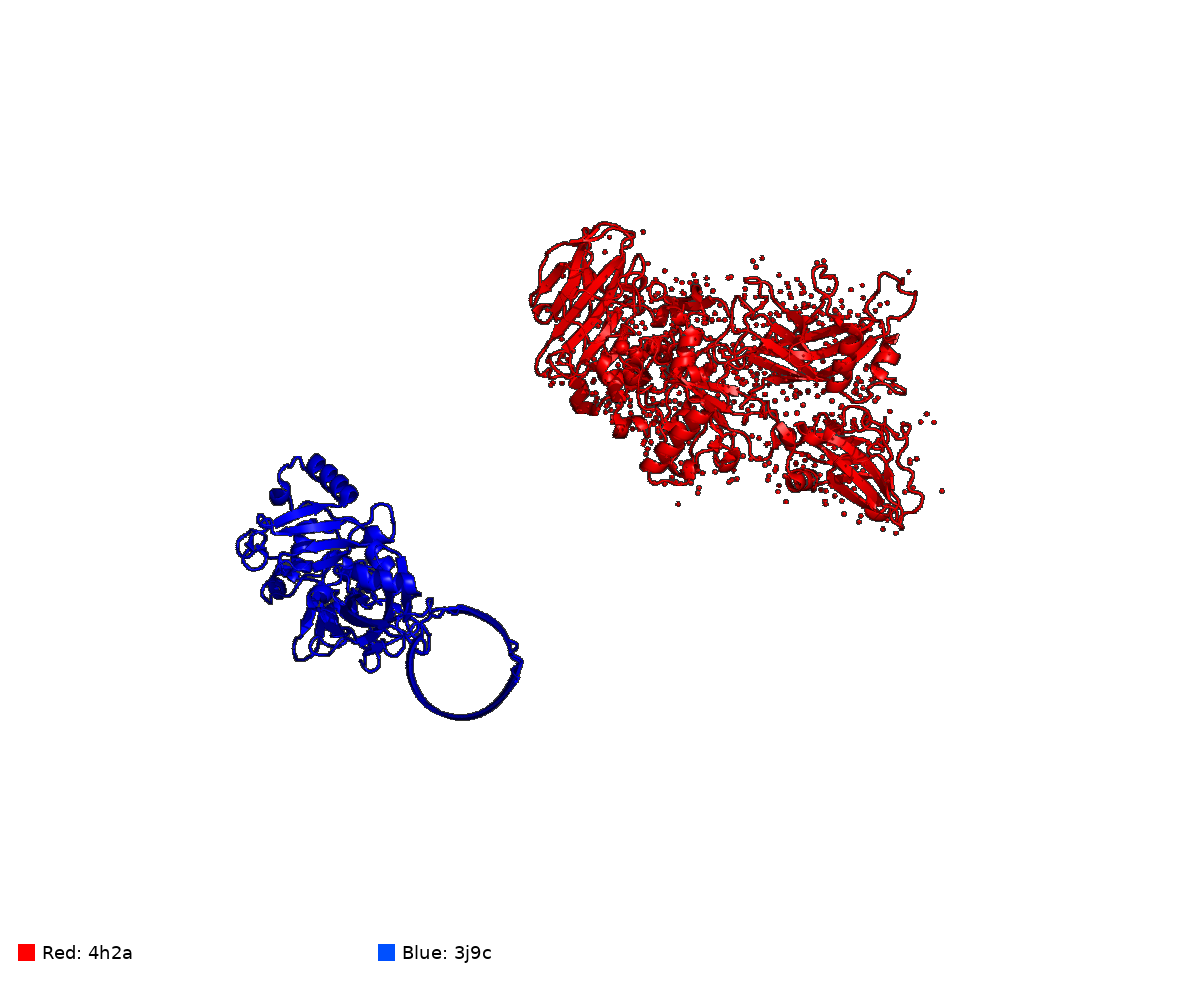
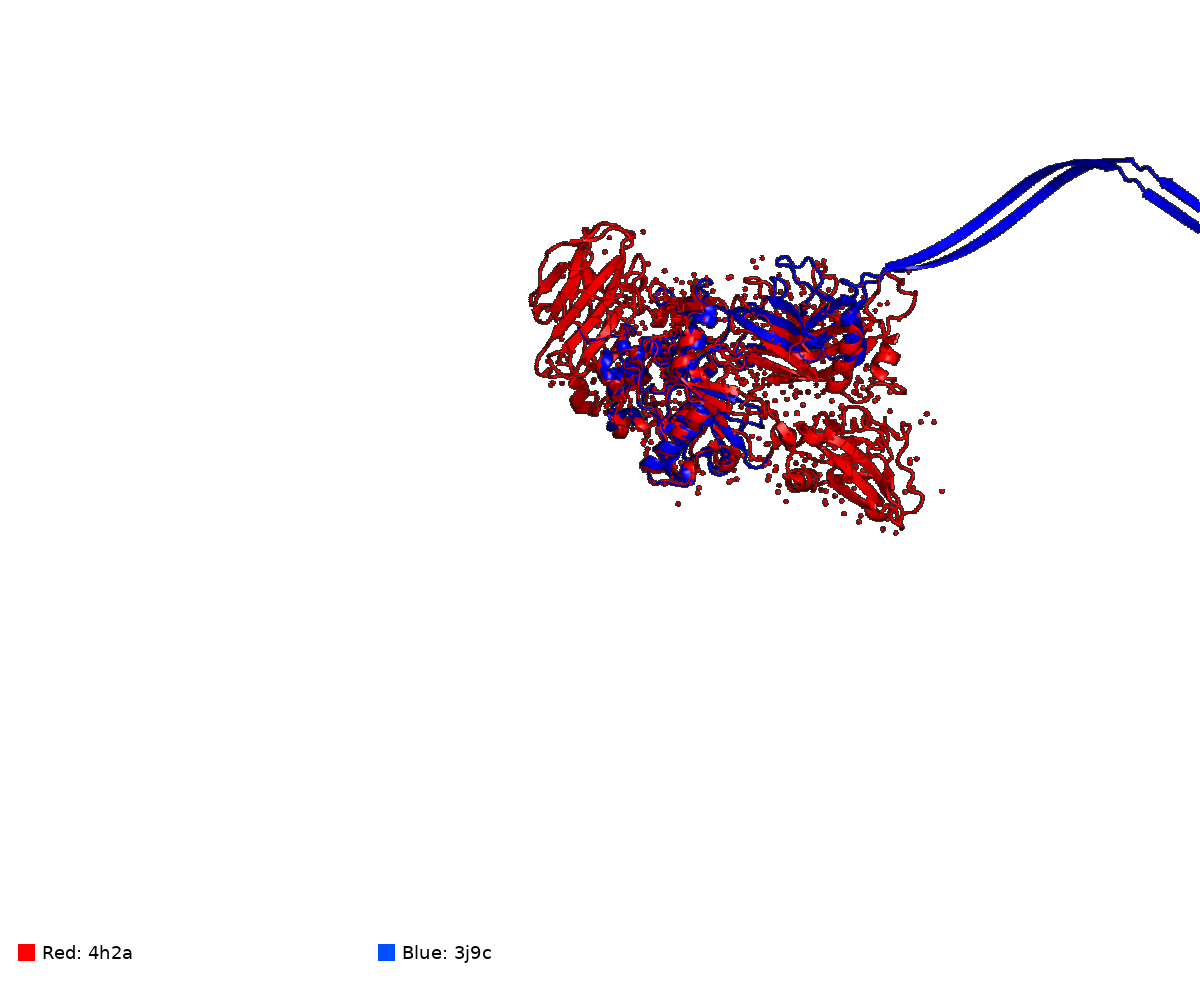
4h2aA vs 3j9cA
Missing: Fold1 vs best AF2
Missing: Fold2 vs best AF2
Missing: Fold1 vs best AF3
Missing: Fold2 vs best AF3
Missing: Fold1 vs best ESM2
Missing: Fold2 vs best ESM2
Missing: Fold1 vs best ESM3
Missing: Fold2 vs best ESM3
[missing] 4h2aA vs. 3j9cA (unaligned) — interactive
[missing] 4h2aA vs. 3j9cA (aligned) — interactive
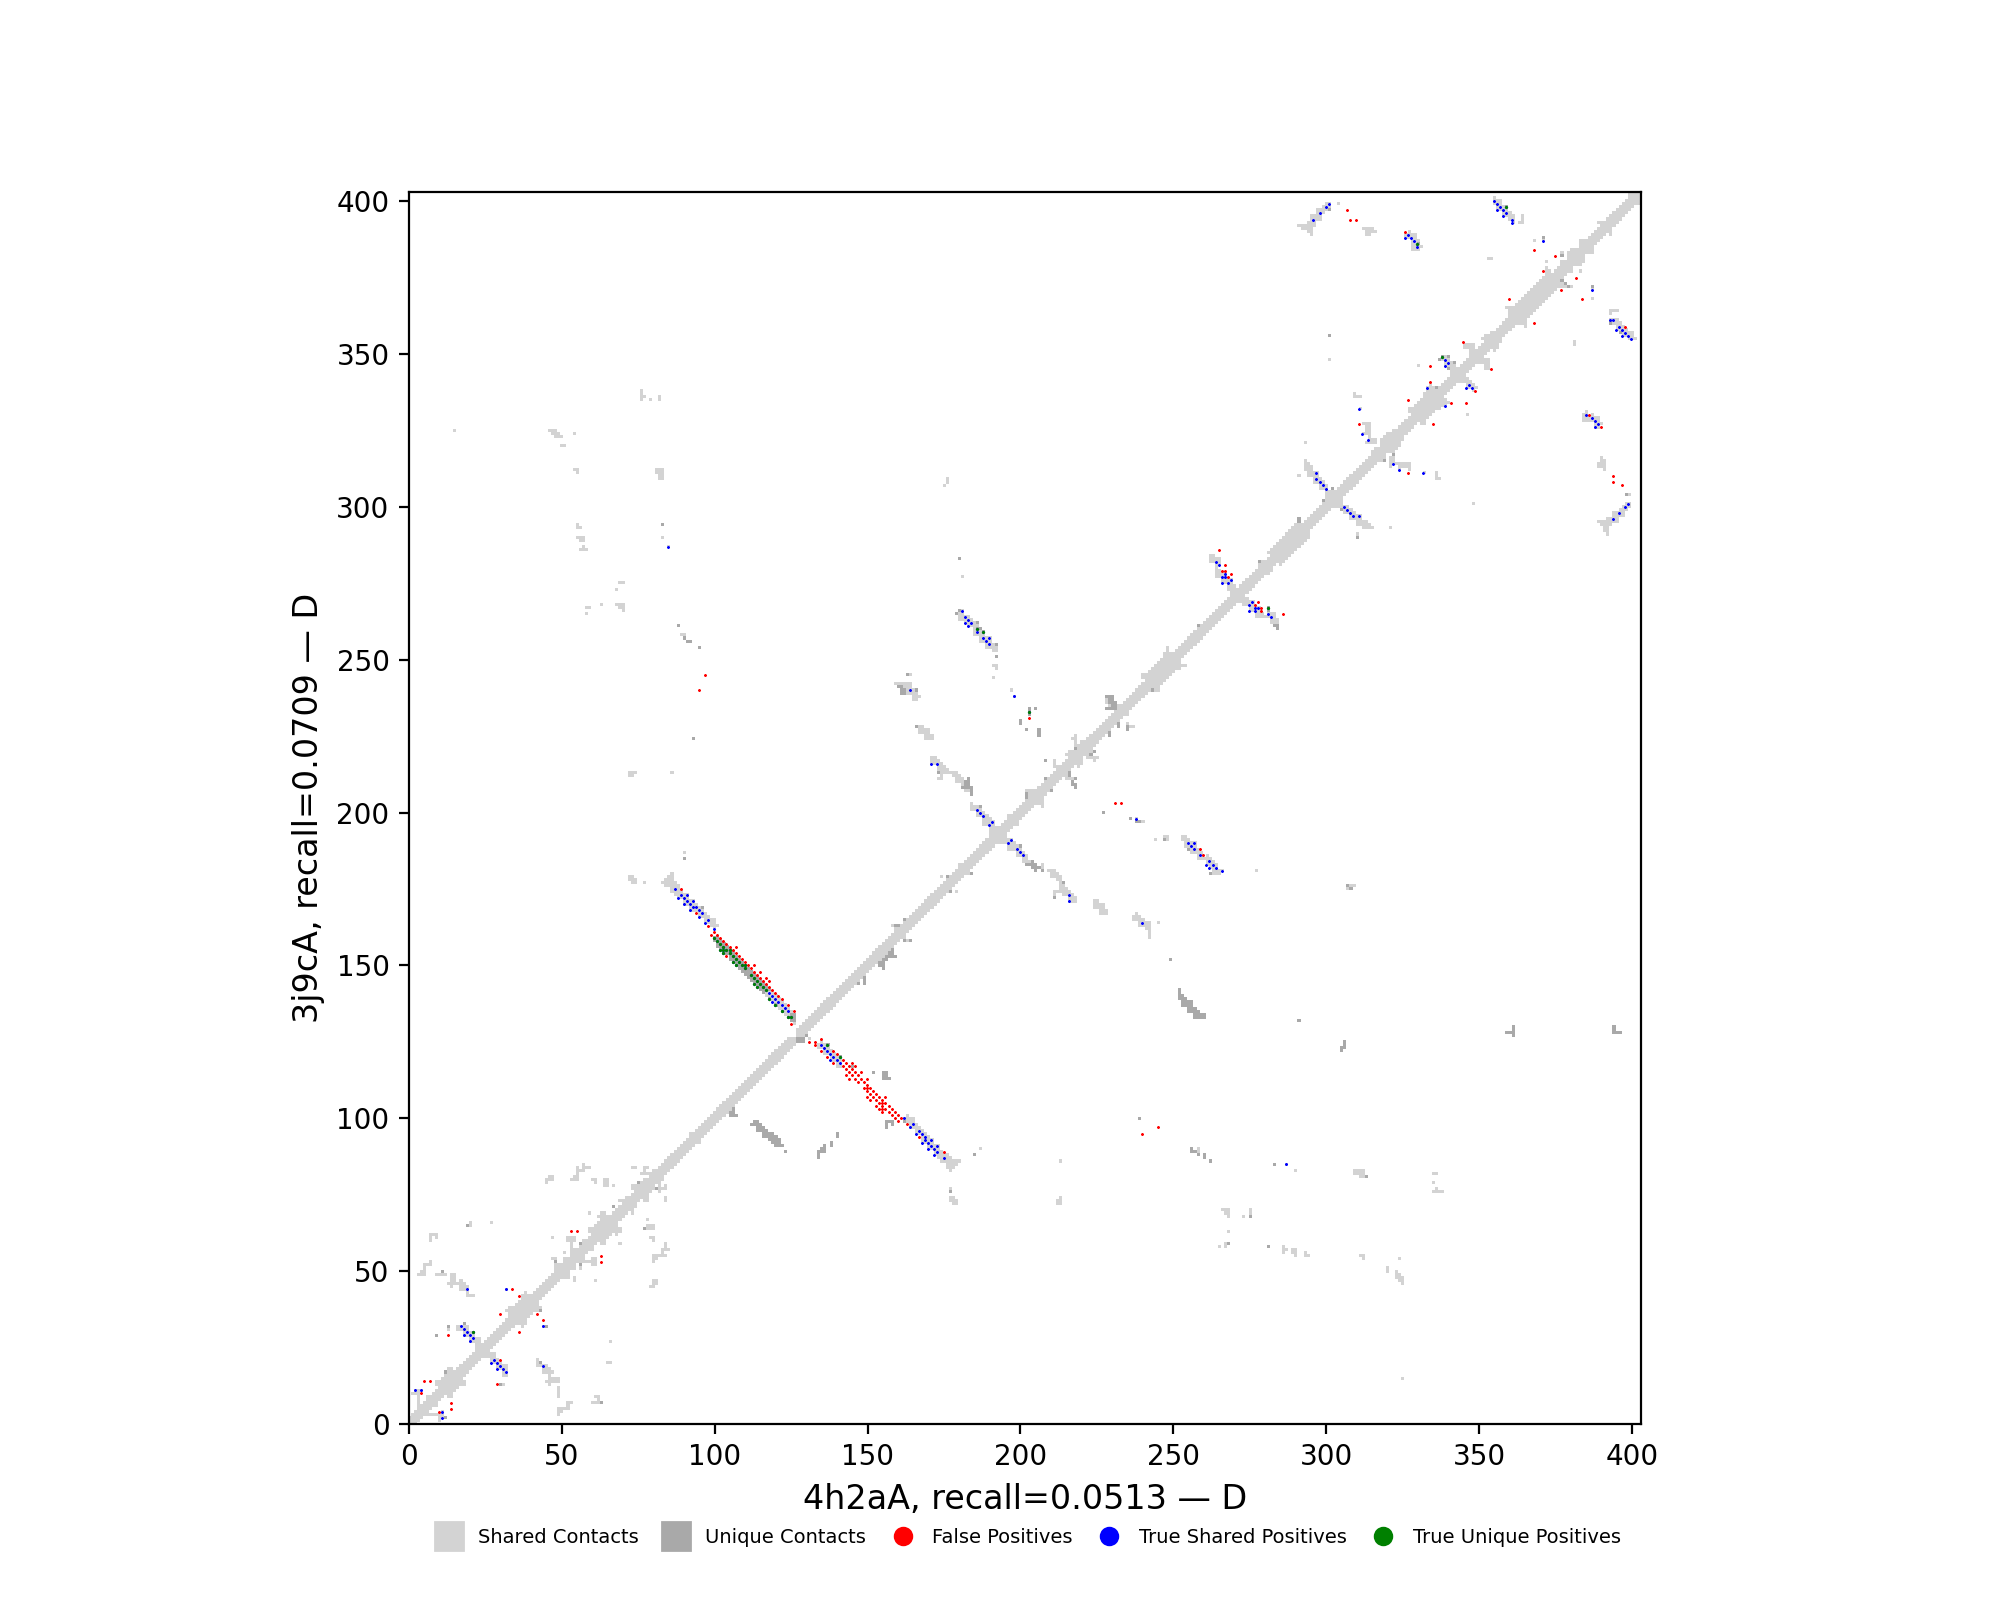
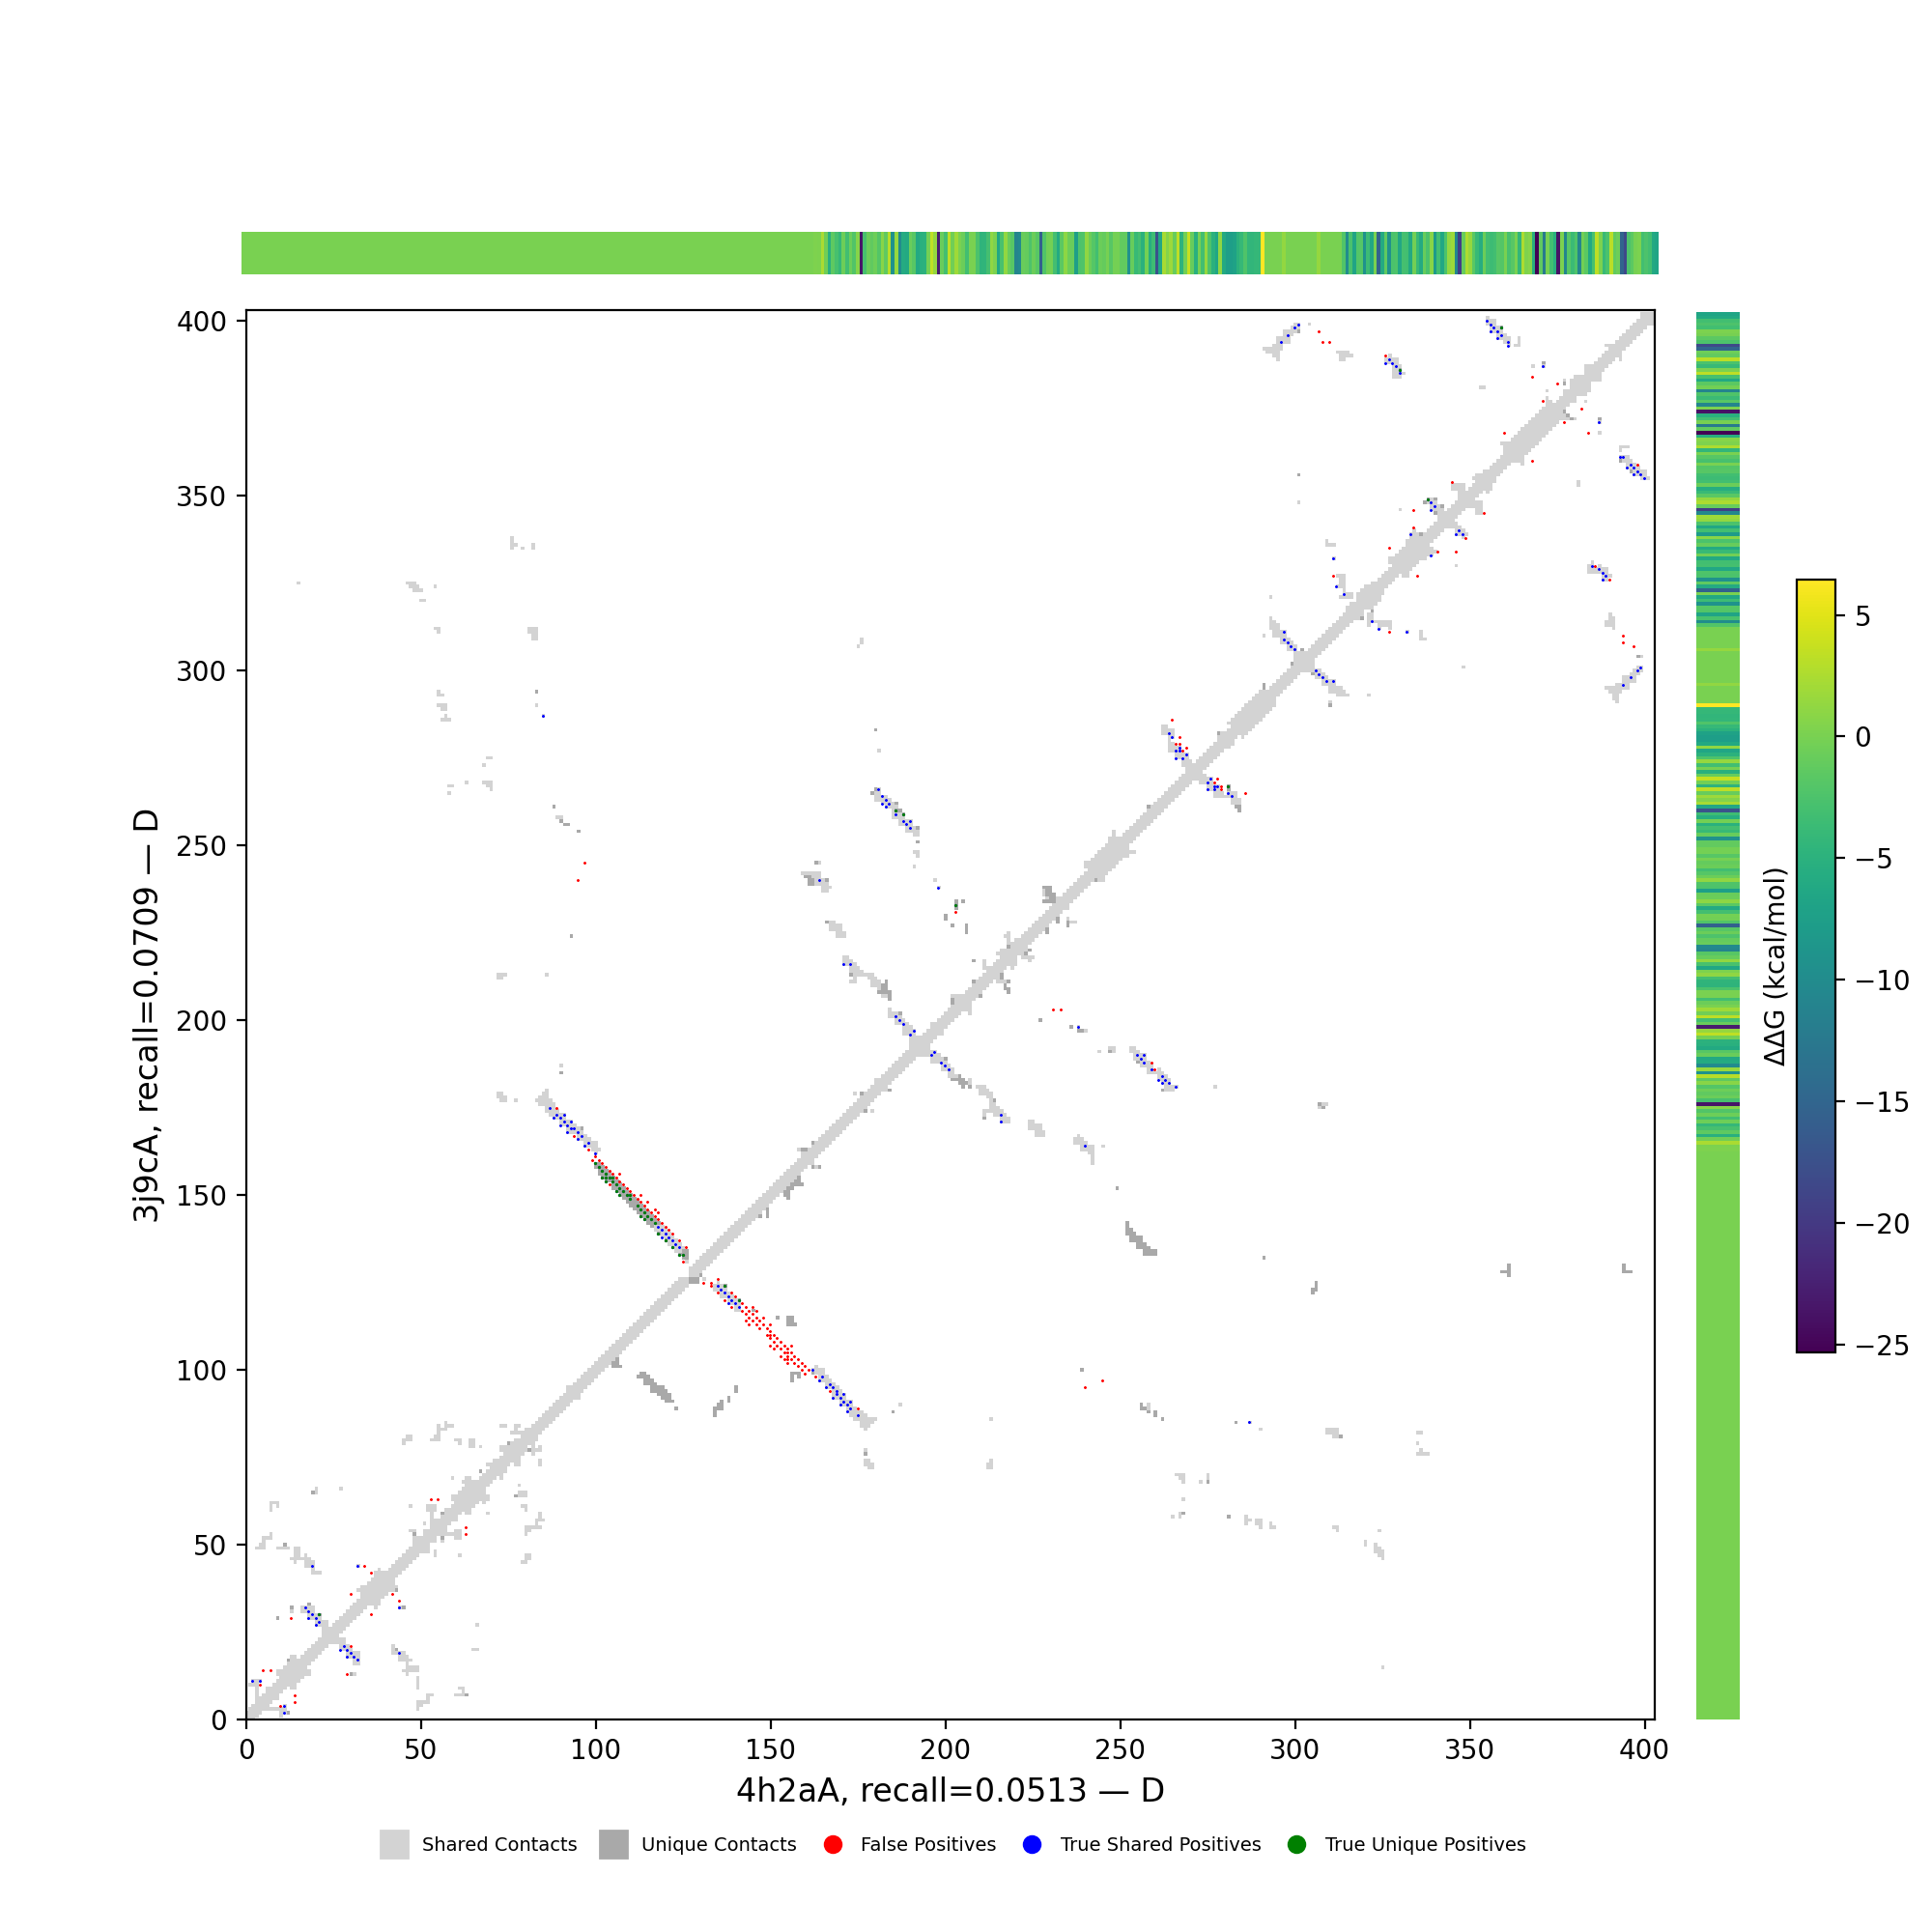
Per-cluster contact maps
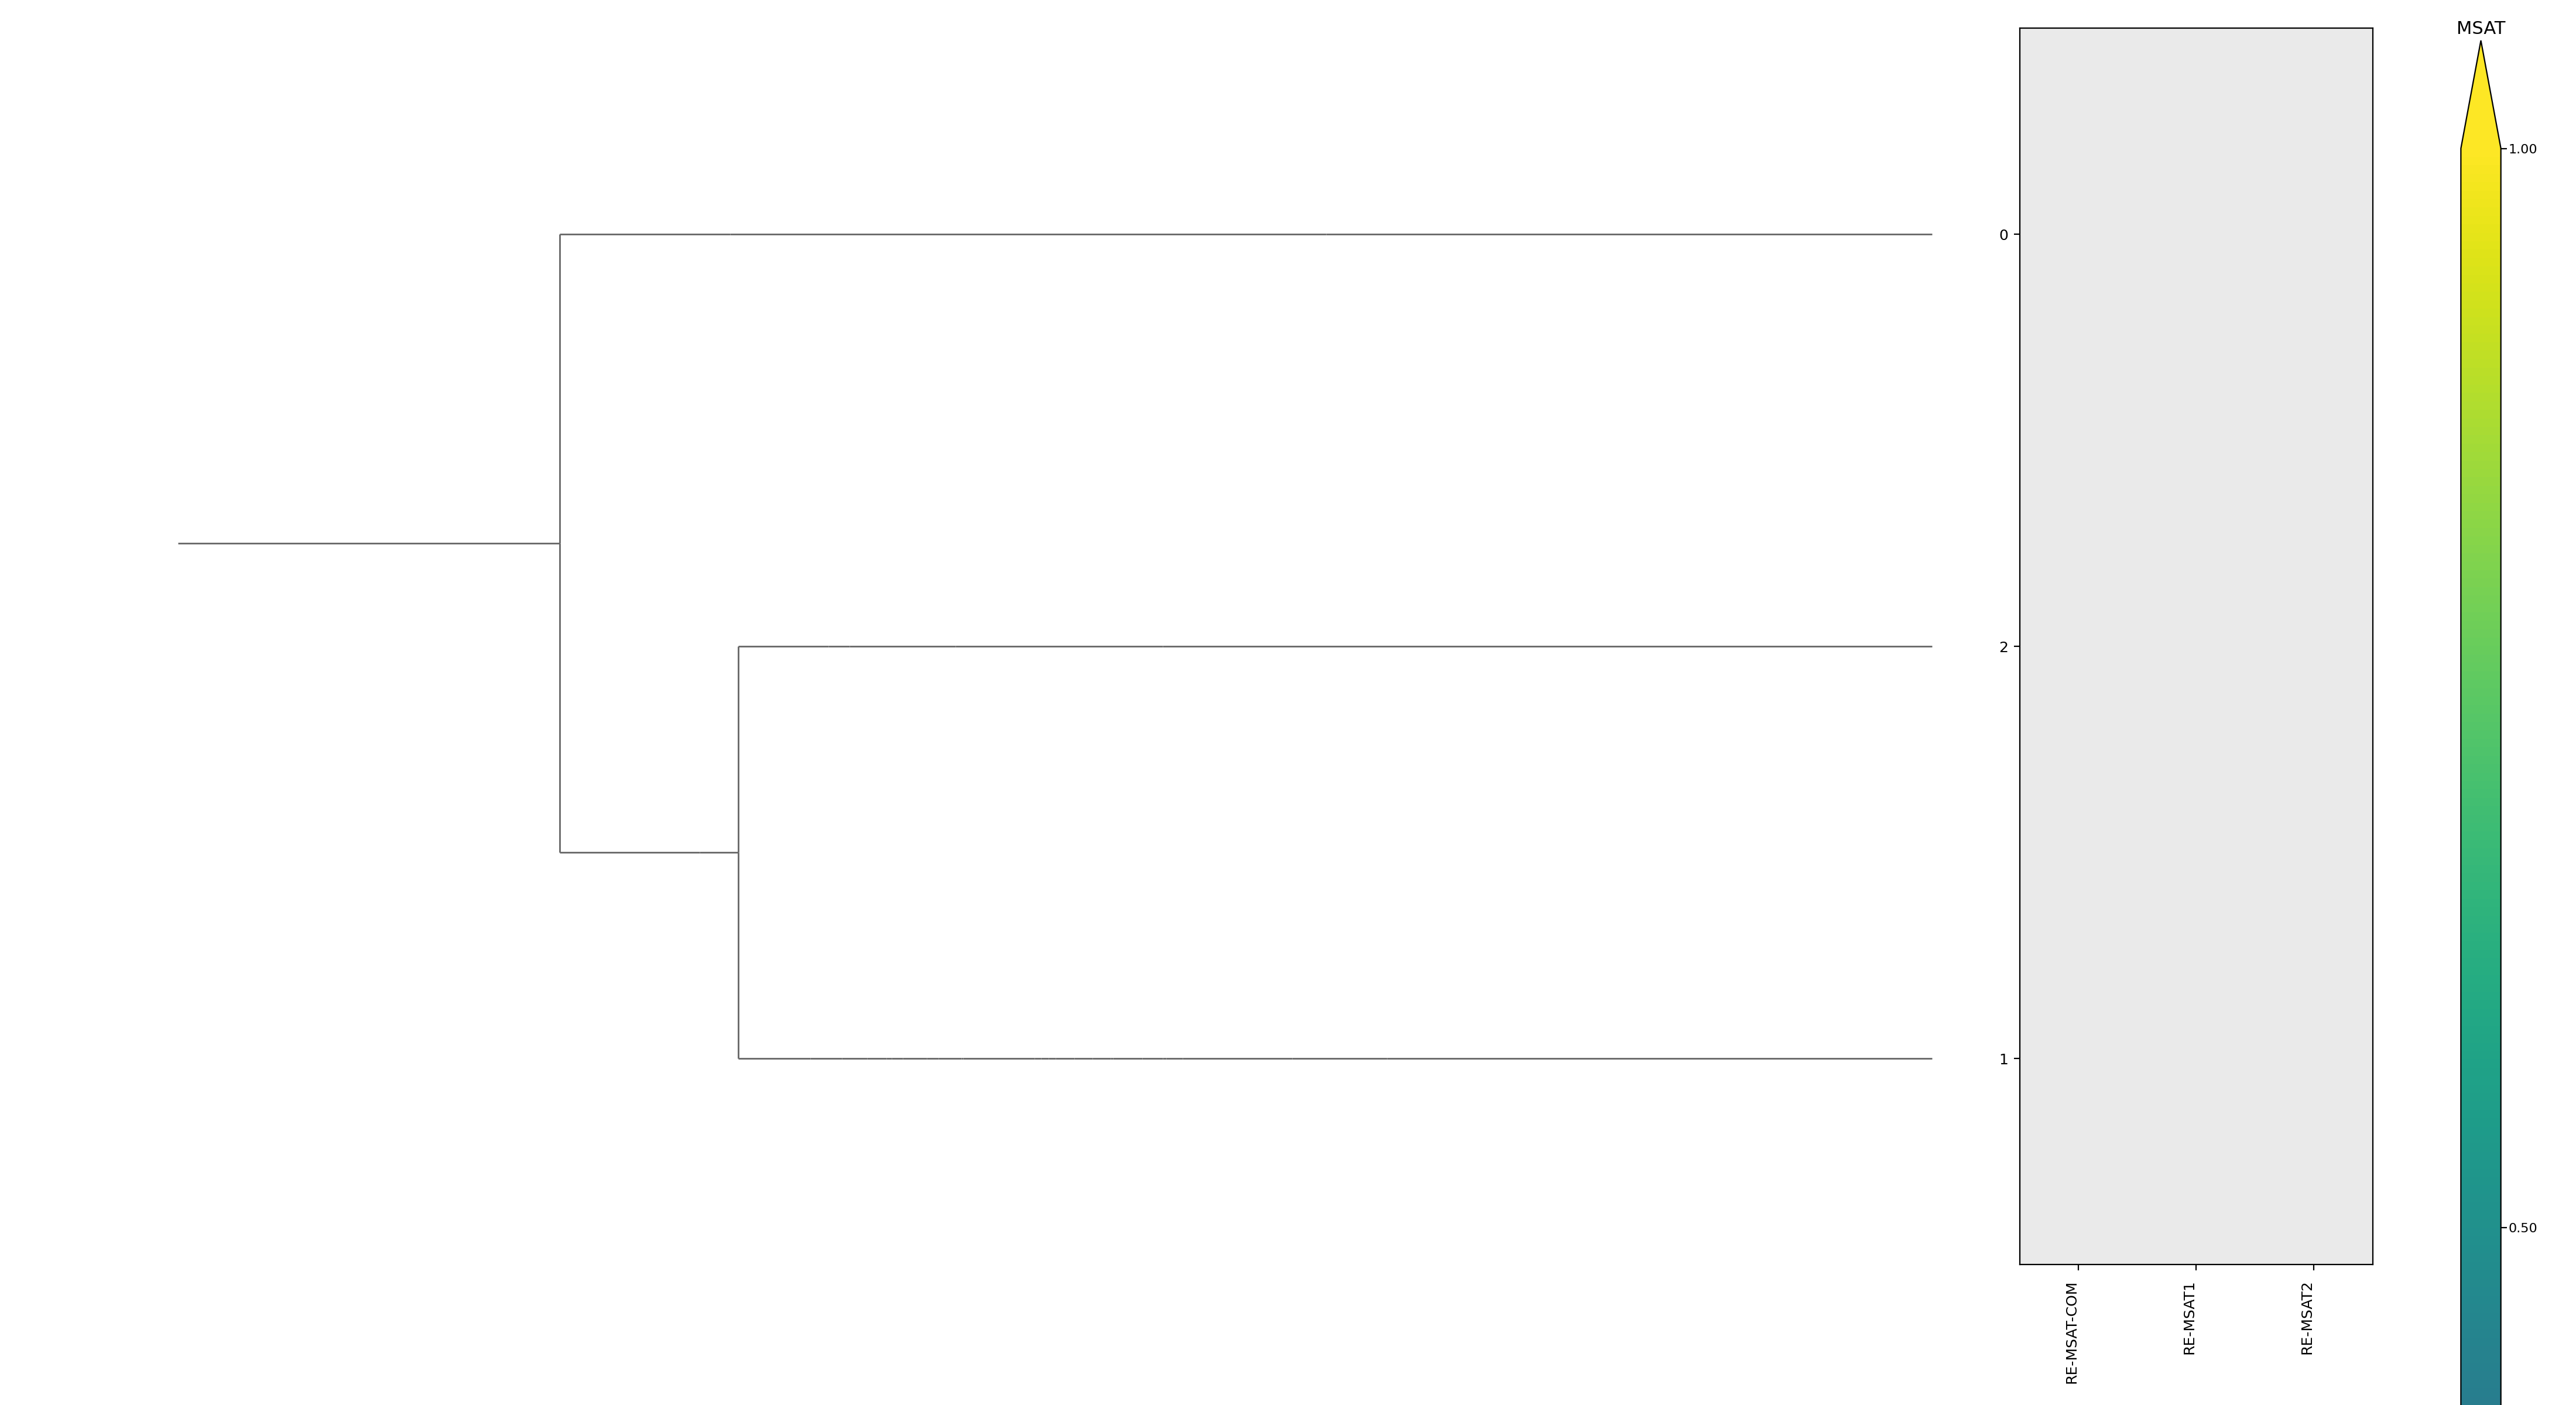
Cluster metrics table
| cluster | n | neff | AF2_TM1 | AF2_TM2 | AF3_TM1 | AF3_TM2 | RE-MSAT-COM | RE-MSAT1 | RE-MSAT2 | ESM_SEQIDS | ESM_TM1_LIST | ESM_TM2_LIST |
|---|
| Deep | - | - | 0.86 | 0.76 | 0.81 | 0.78 | 0.07 | 0.13 | 0.04 | - | - | - |
| 000 | - | - | 0.85 | 0.76 | 0.92 | 0.85 | 0.09 | 0.11 | 0.07 | 002; 002; 001; 001; 005; 005; 006; 003; 003; 007 | 0.74; 0.74; 0.70; 0.69; 0.68; 0.68; 0.66; 0.64; 0.64; 0.61 | 0.71; 0.71; 0.68; 0.68; 0.64; 0.64; 0.70; 0.68; 0.68; 0.59 |
| 001 | - | - | 0.55 | 0.77 | 0.55 | 0.78 | 0.04 | 0.02 | 0.02 | 008; 008; 002; 002; 004; 004; 005; 009; 009; 005 | 0.69; 0.69; 0.69; 0.69; 0.65; 0.65; 0.63; 0.63; 0.63; 0.63 | 0.67; 0.67; 0.67; 0.67; 0.66; 0.66; 0.70; 0.67; 0.67; 0.70 |
| 002 | - | - | 0.73 | 0.73 | 0.73 | 0.75 | 0.07 | 0.14 | 0.05 | 002; 002; 006; 006; 001; 001; 003; 003; 007; 007 | 0.74; 0.74; 0.73; 0.73; 0.70; 0.70; 0.68; 0.68; 0.67; 0.67 | 0.72; 0.72; 0.72; 0.73; 0.68; 0.68; 0.67; 0.67; 0.63; 0.63 |