Analysis of pair 2kkwA_2n0aD
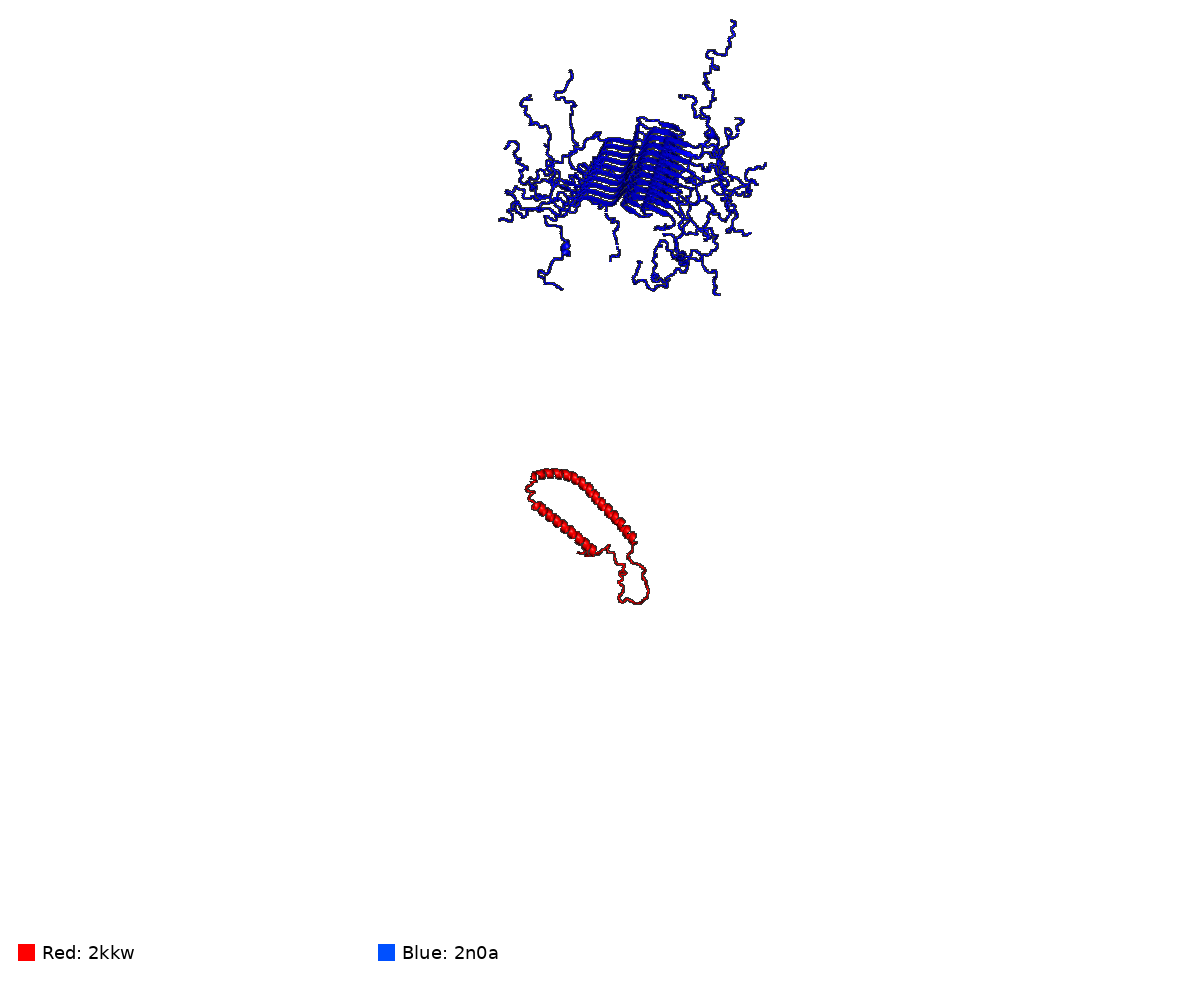
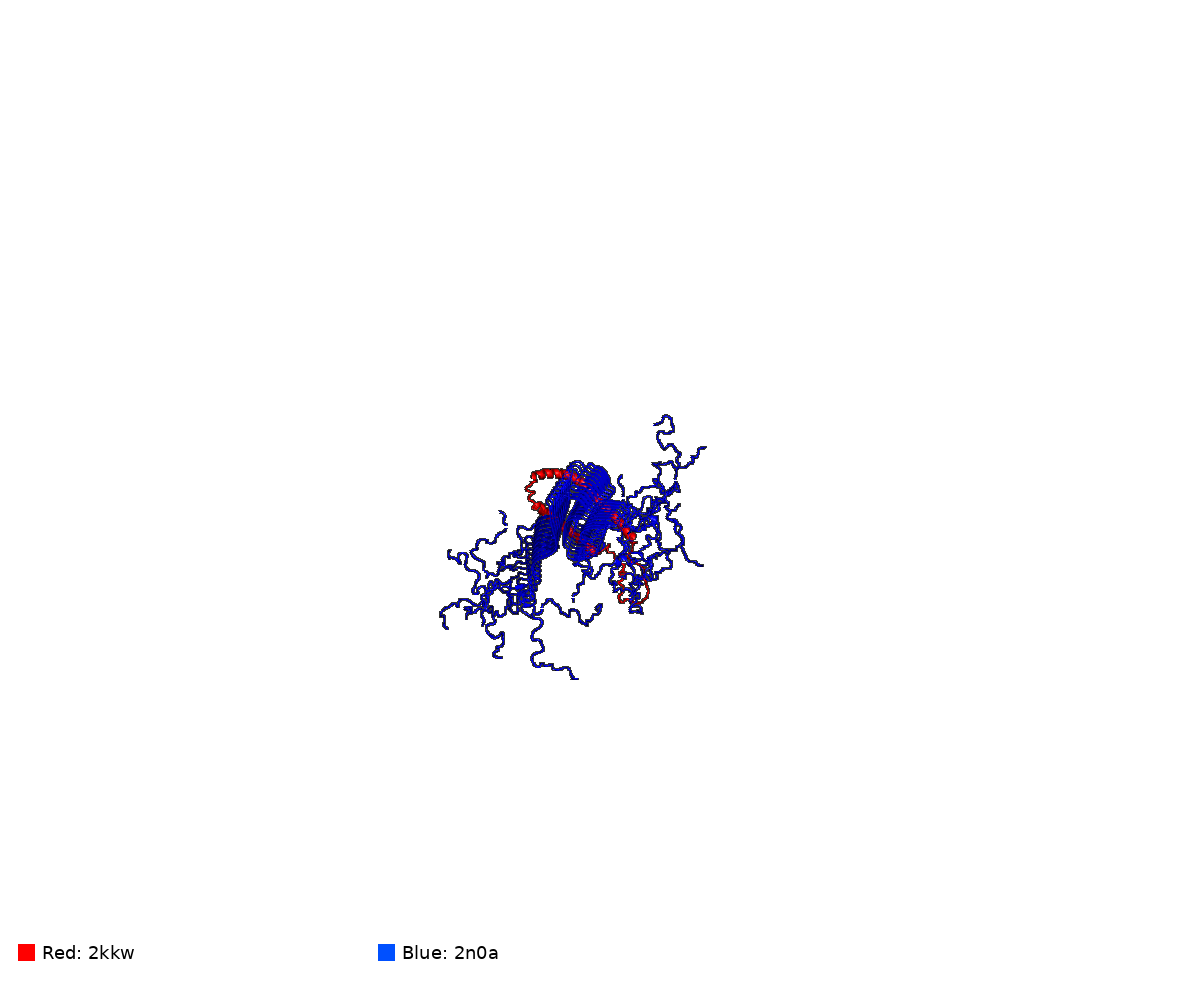
2kkwA vs 2n0aD
Missing: Fold1 vs best AF2
Missing: Fold2 vs best AF2
Missing: Fold1 vs best AF3
Missing: Fold2 vs best AF3
Missing: Fold1 vs best ESM2
Missing: Fold2 vs best ESM2
Missing: Fold1 vs best ESM3
Missing: Fold2 vs best ESM3
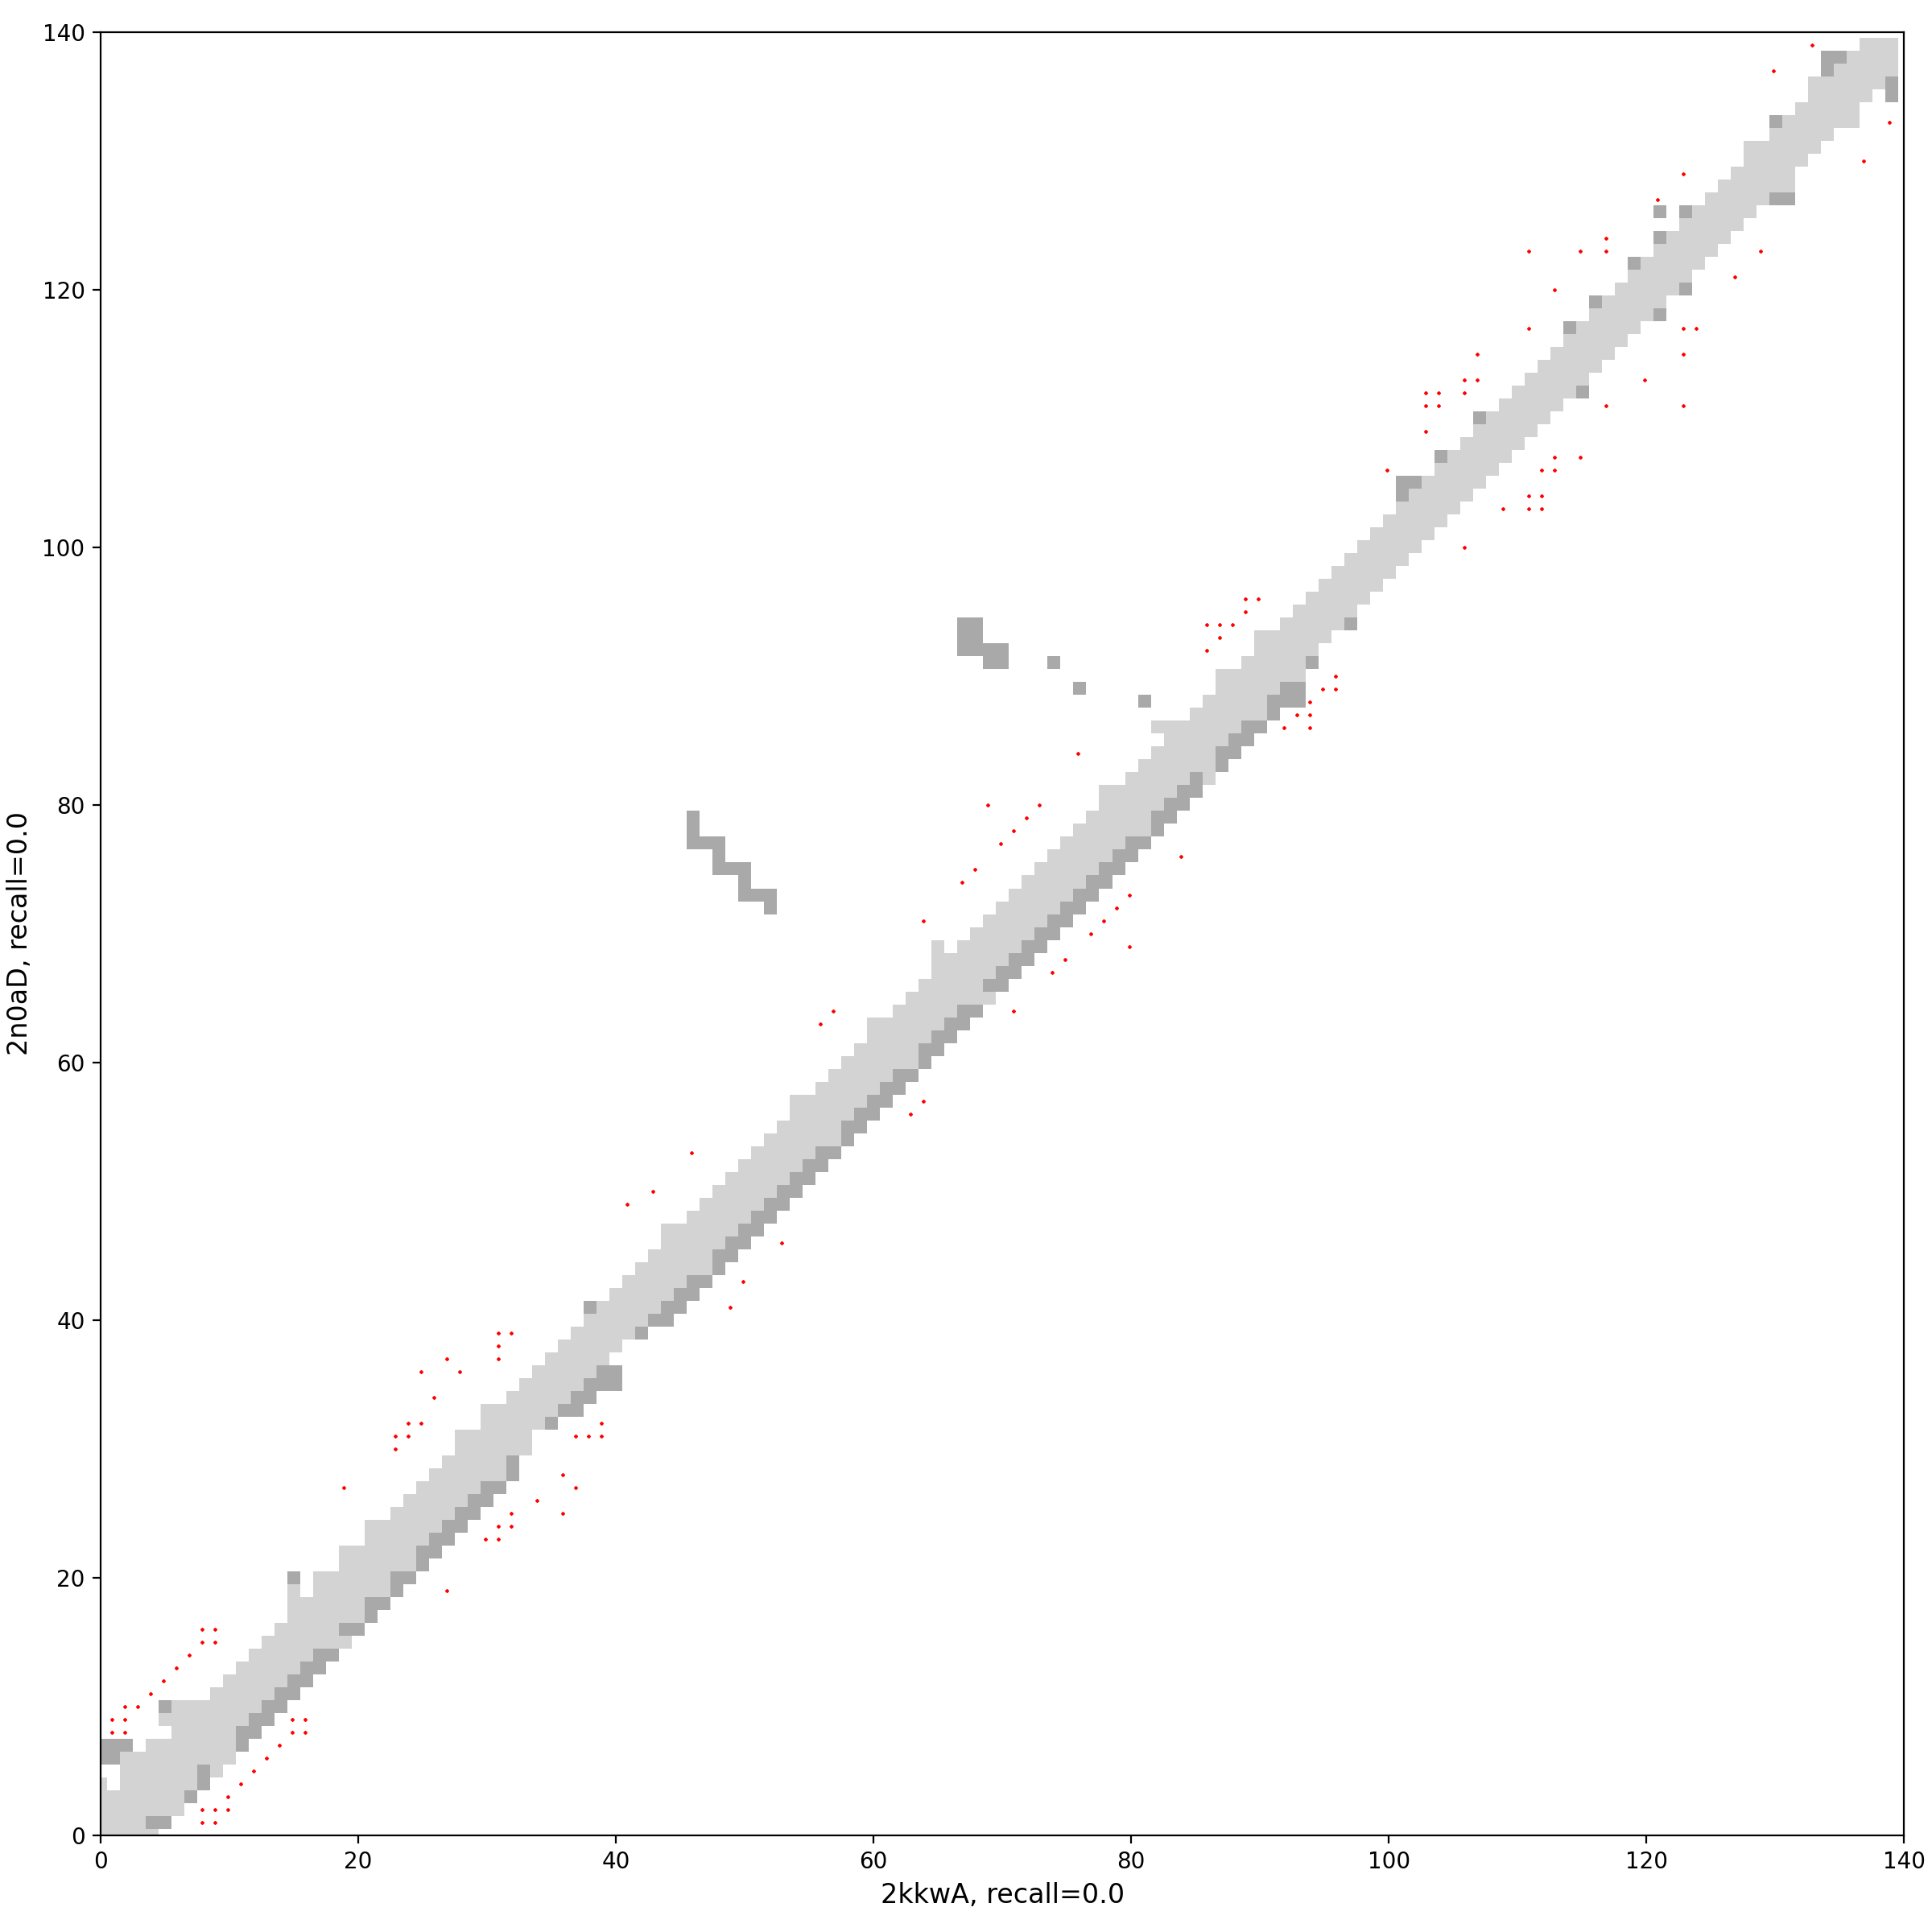
[missing] 2kkwA vs. 2n0aD (unaligned) — interactive
[missing] 2kkwA vs. 2n0aD (aligned) — interactive
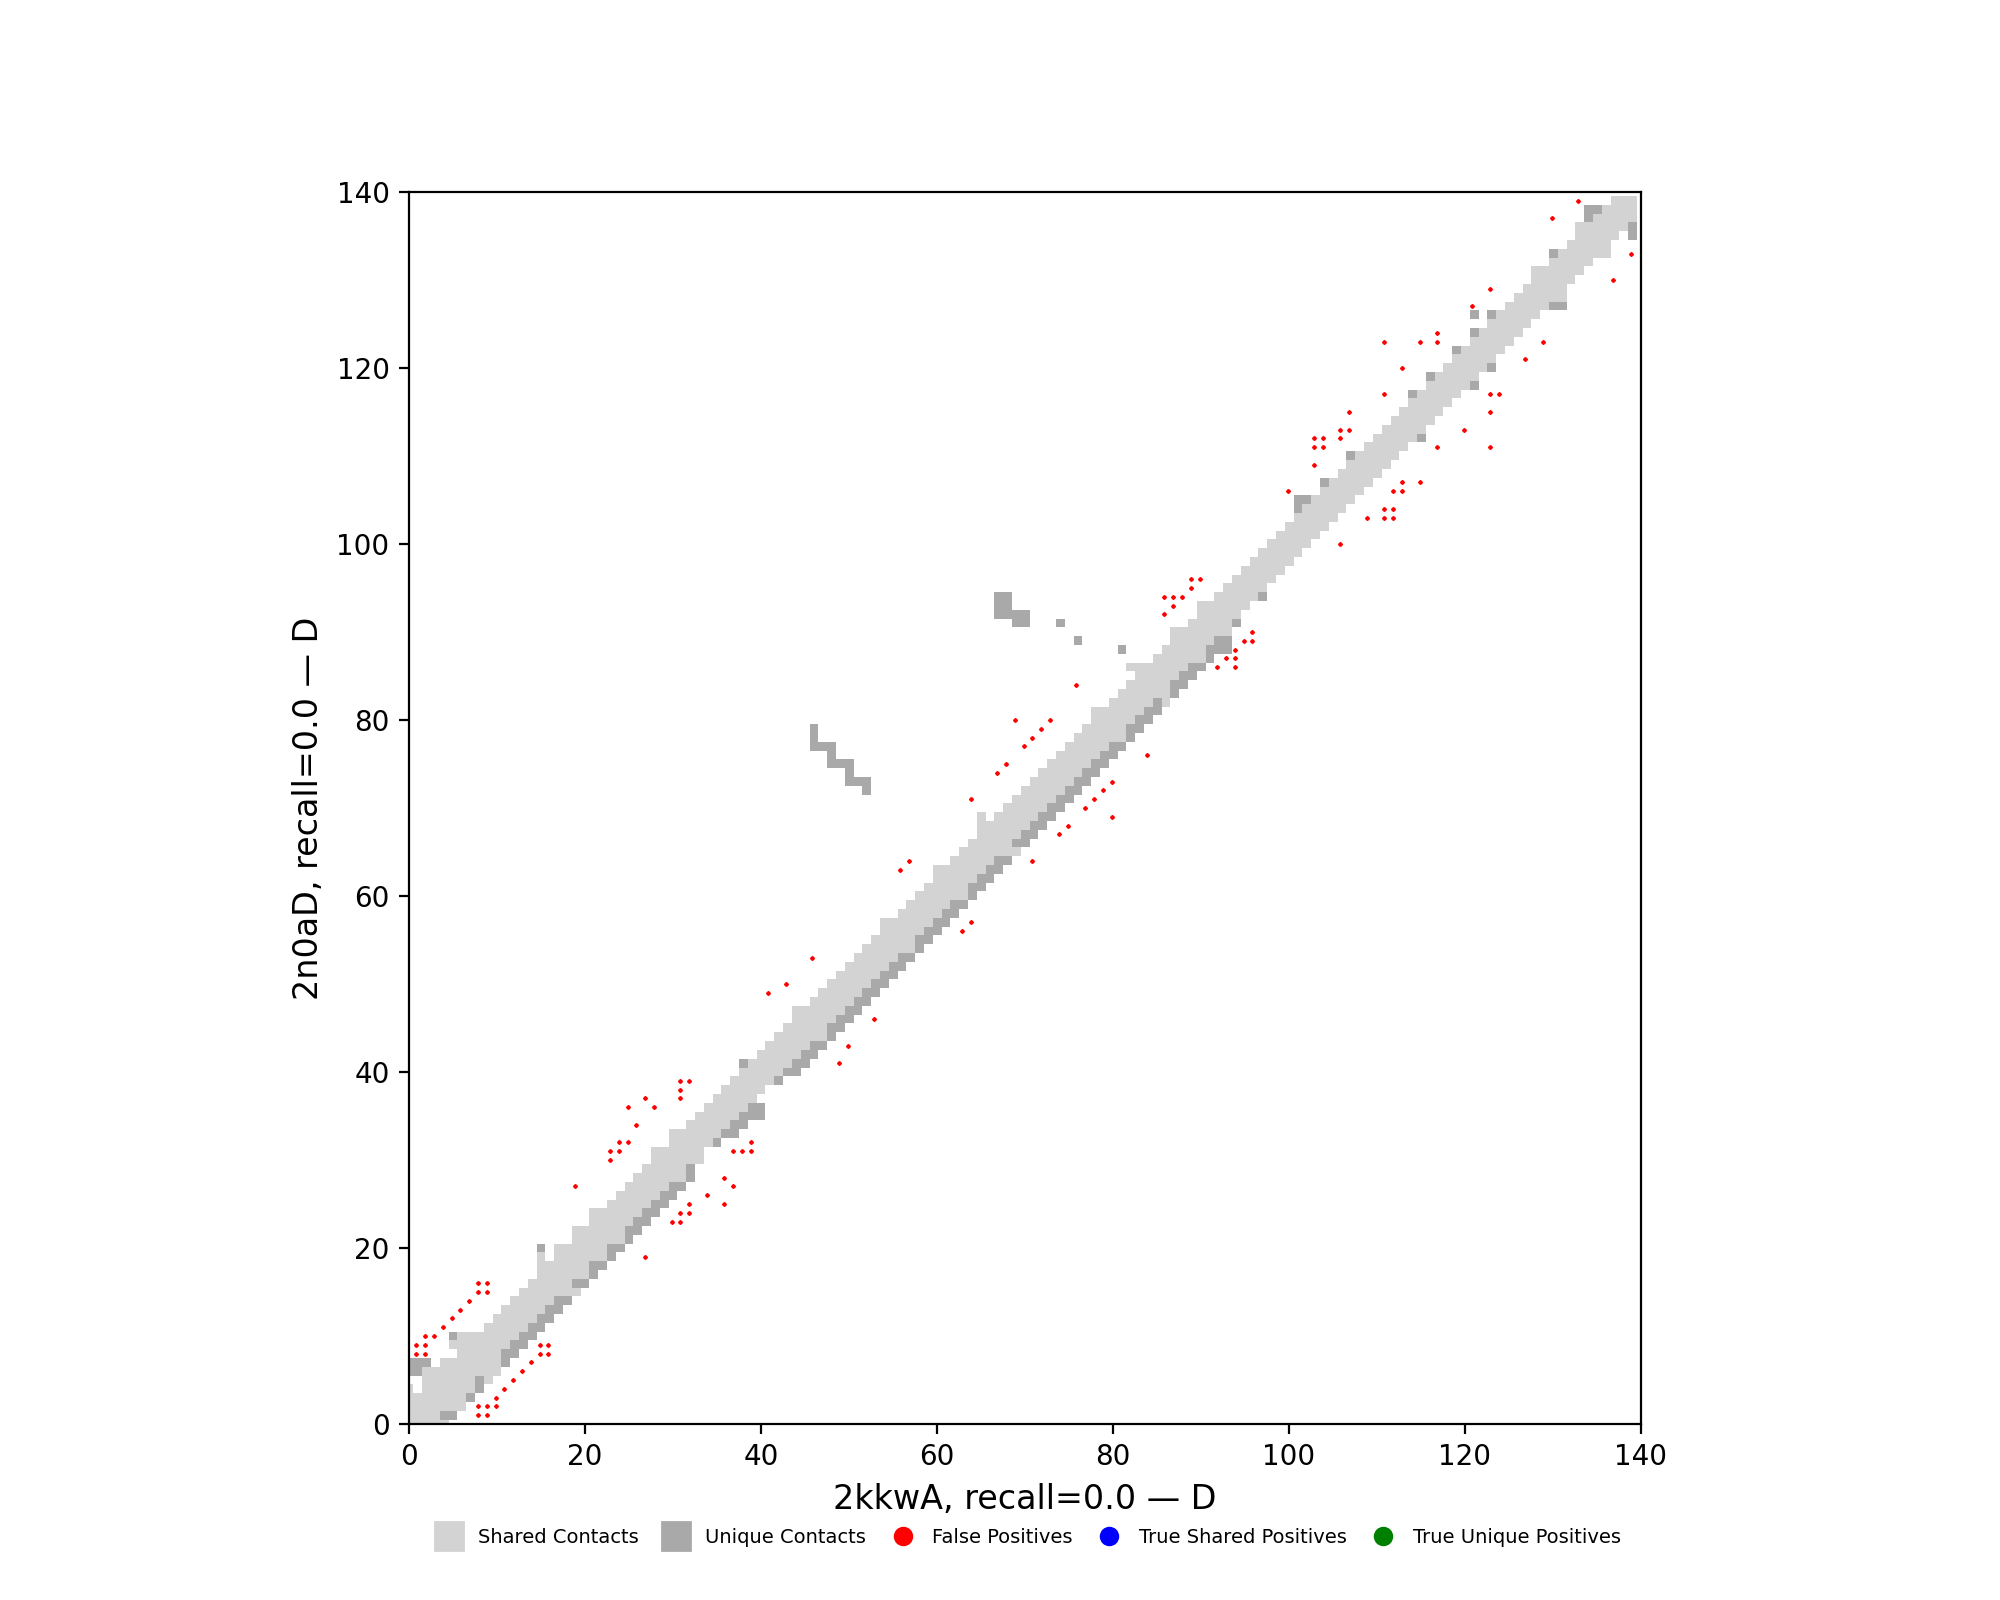
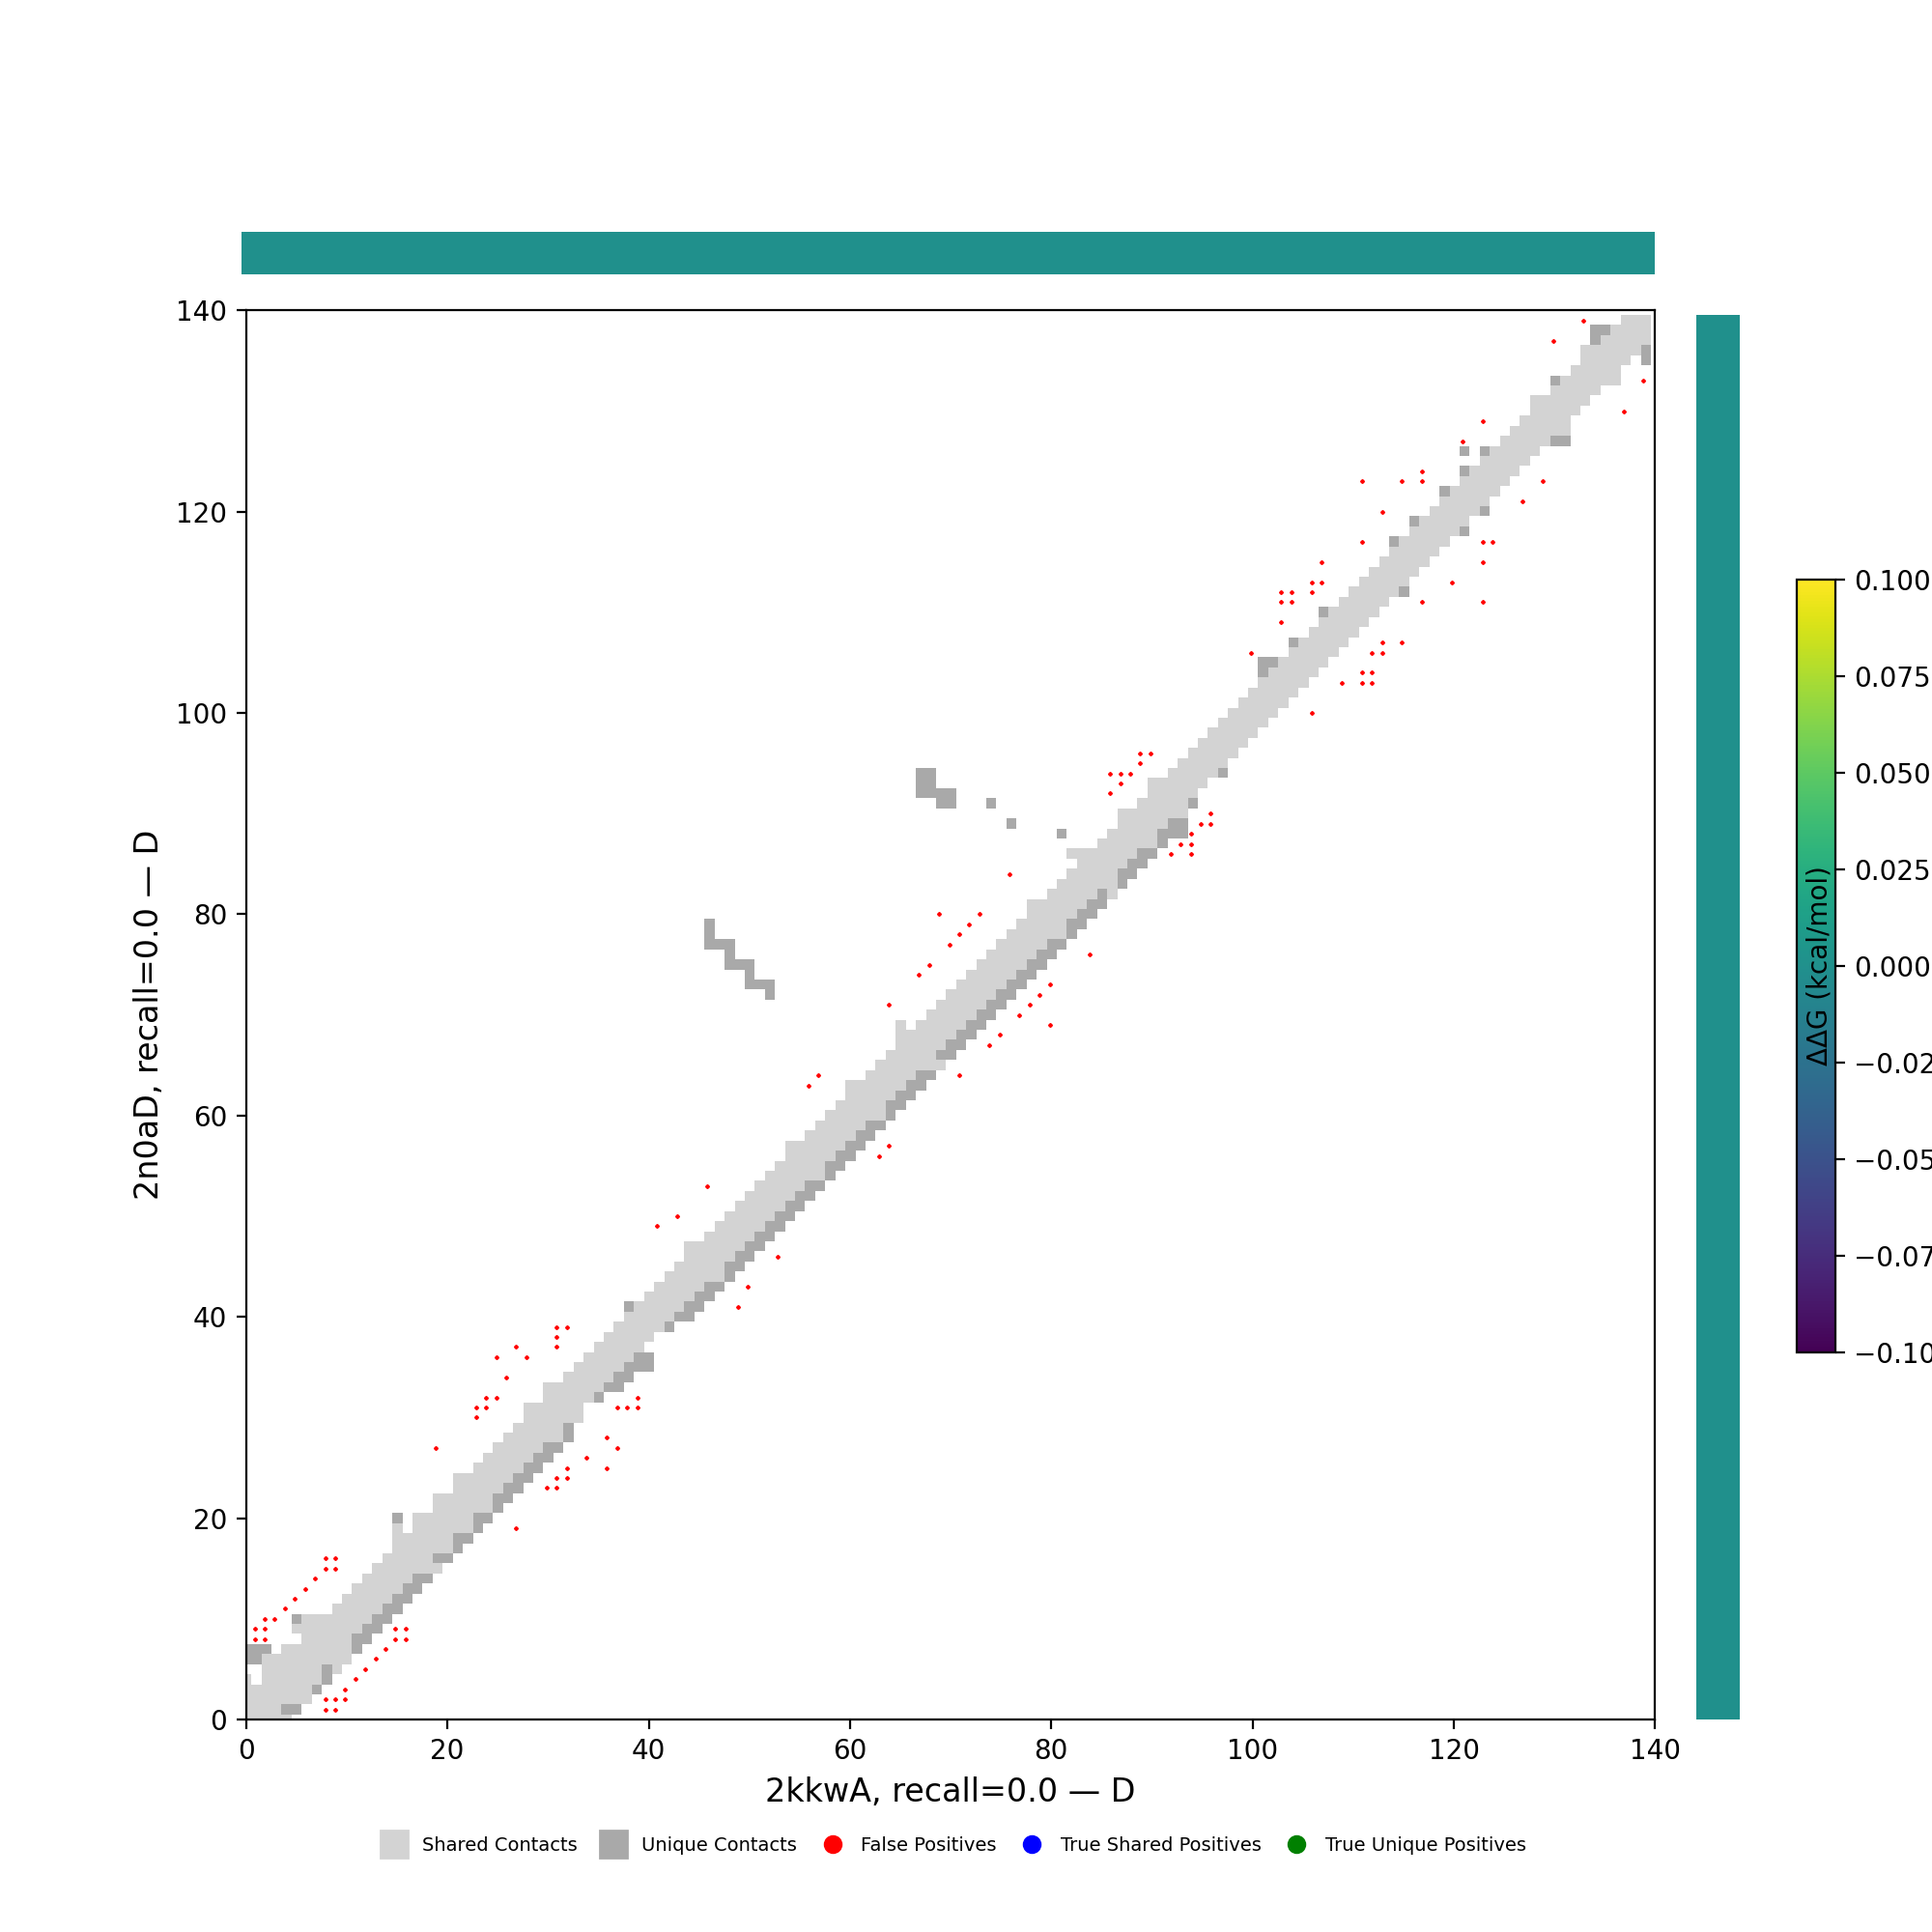
Per-cluster contact maps
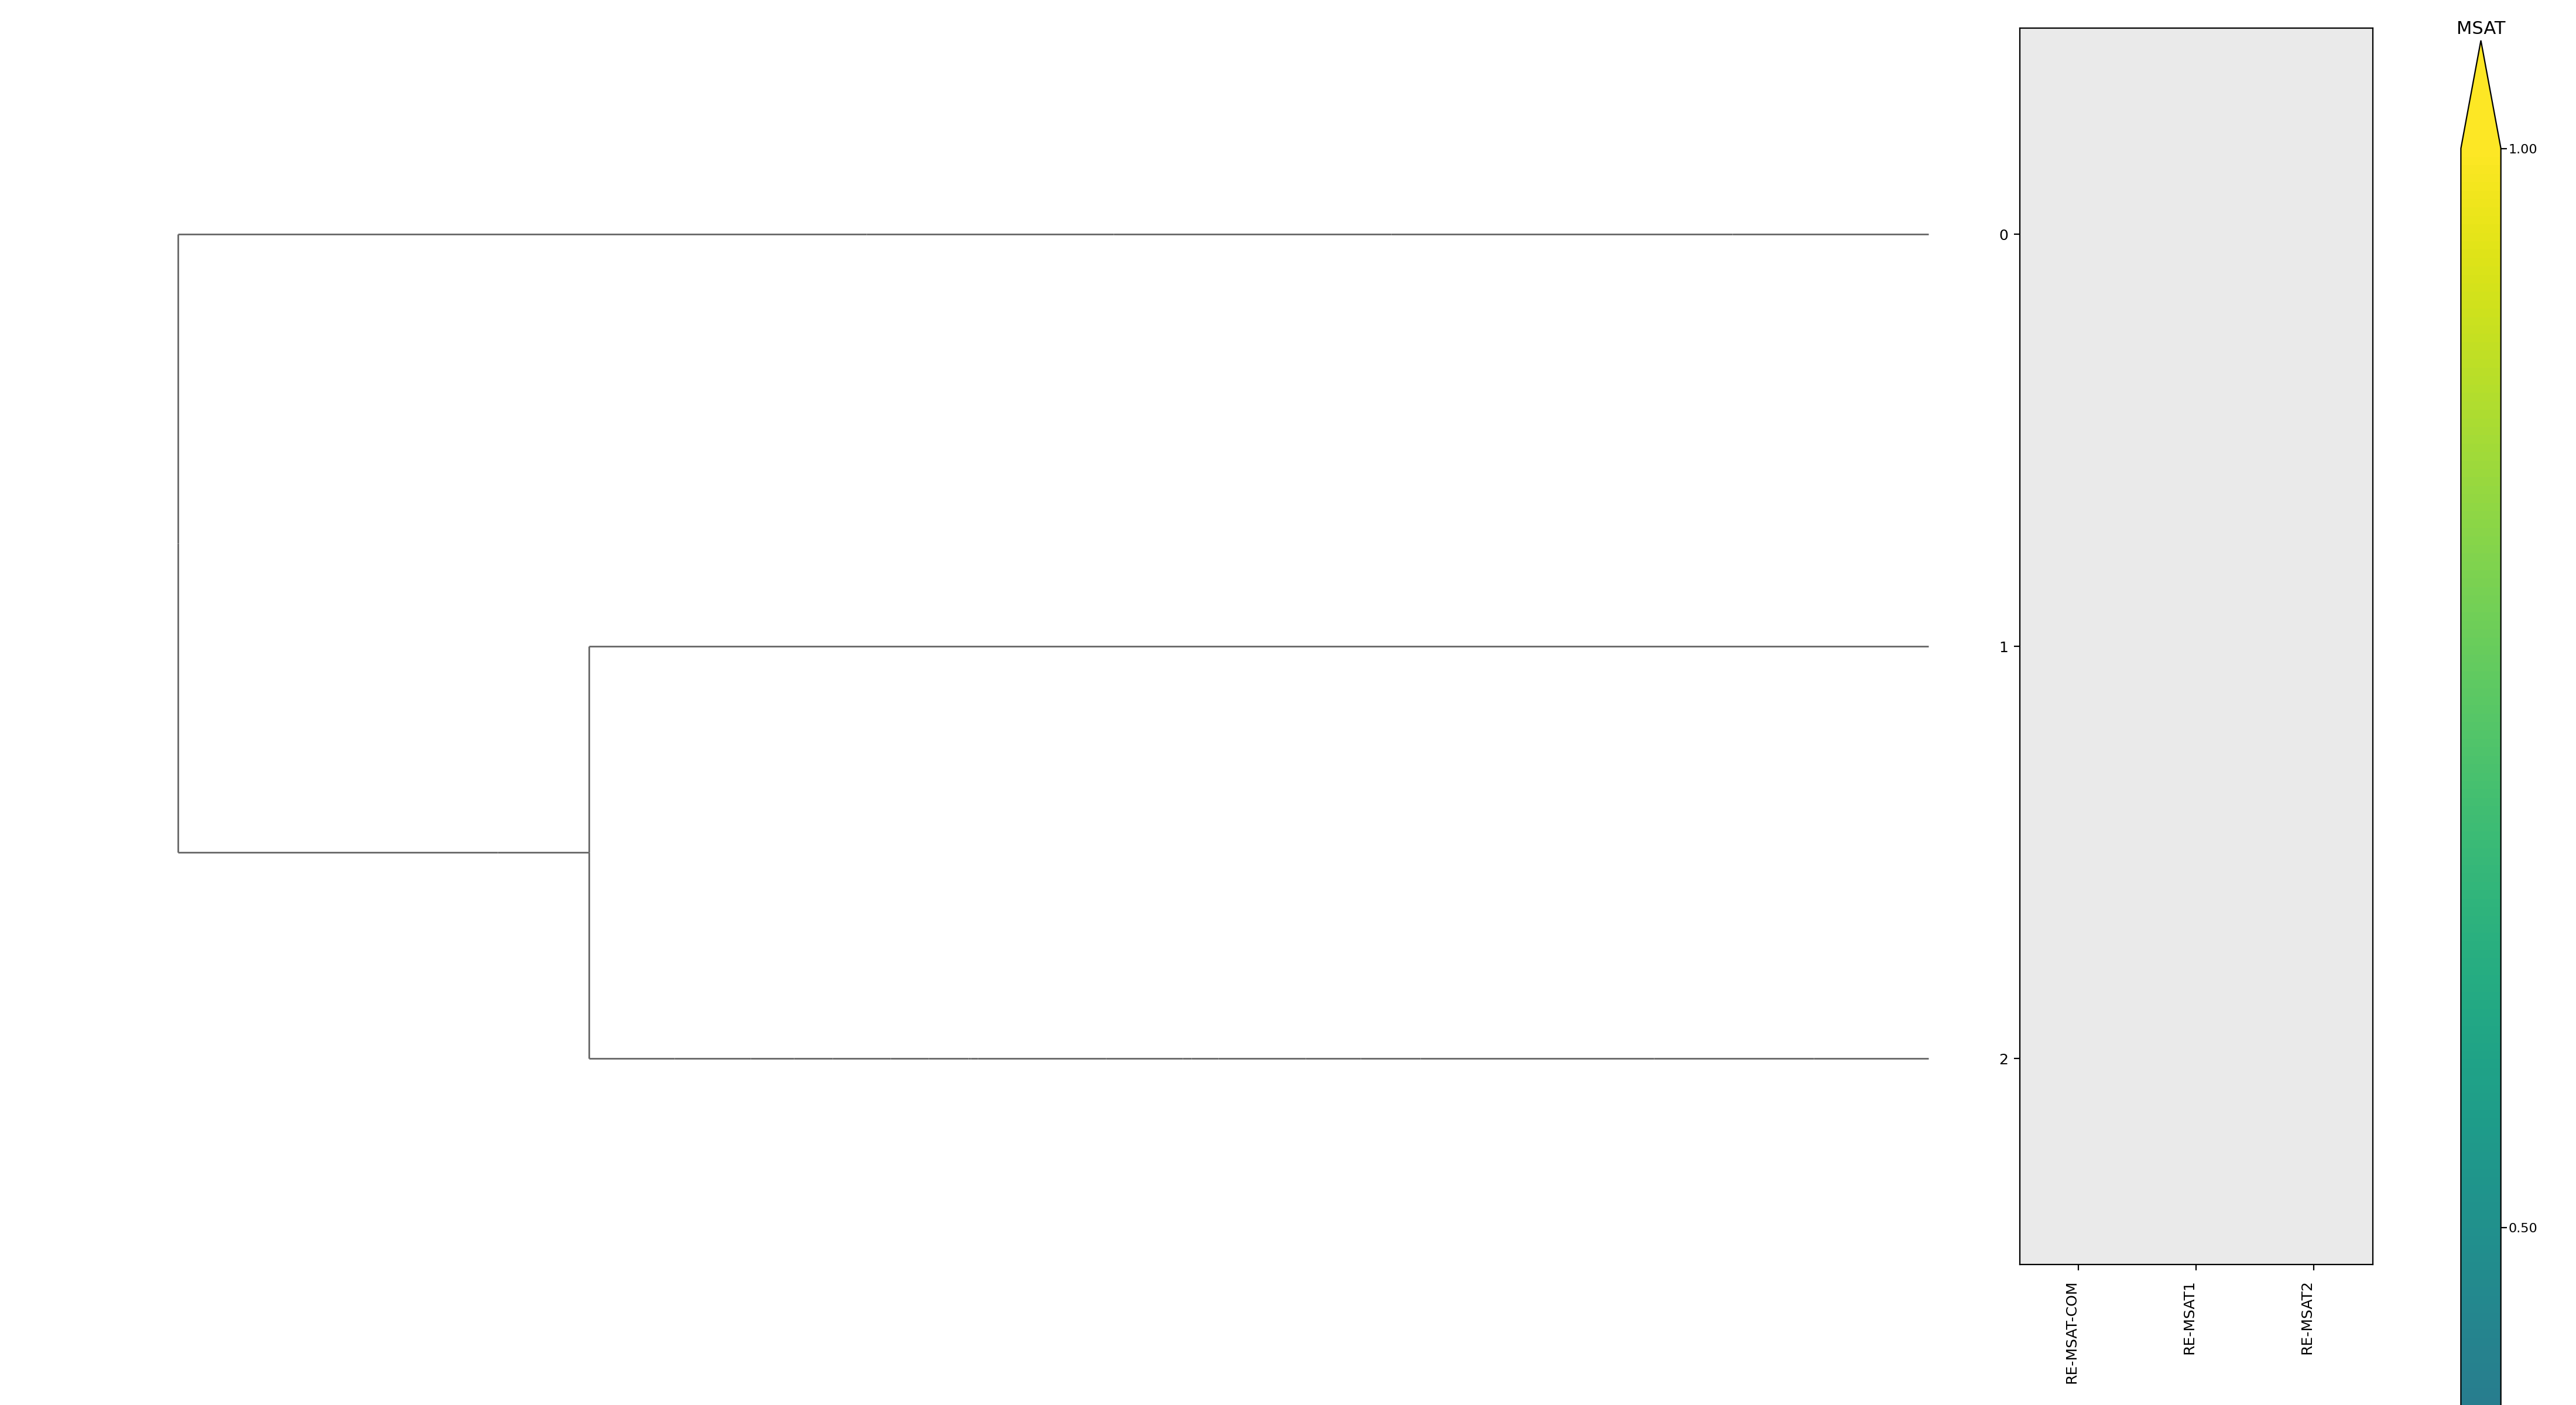
Cluster metrics table
| cluster | n | neff | AF2_TM1 | AF2_TM2 | AF3_TM1 | AF3_TM2 | RE-MSAT-COM | RE-MSAT1 | RE-MSAT2 | ESM_SEQIDS | ESM_TM1_LIST | ESM_TM2_LIST |
|---|
| Deep | - | - | 0.36 | 0.16 | 0.31 | 0.18 | 0.0 | 0.0 | 0.0 | - | - | - |
| 000 | - | - | 0.33 | 0.21 | 0.28 | 0.15 | 0.0 | 0.0 | 0.0 | 009; 009; 004; 004; 001; 007; 007; 010; 003; 010 | 0.30; 0.29; 0.29; 0.26; 0.25; 0.25; 0.25; 0.24; 0.24; 0.24 | 0.17; 0.16; 0.23; 0.22; 0.21; 0.27; 0.26; 0.14; 0.20; 0.15 |
| 001 | - | - | 0.35 | 0.21 | 0.33 | 0.2 | 0.0 | 0.0 | 0.0 | 010; 010; 002; 004; 005; 005; 002; 004; 003; 003 | 0.31; 0.31; 0.30; 0.30; 0.30; 0.30; 0.30; 0.29; 0.28; 0.28 | 0.16; 0.18; 0.15; 0.19; 0.16; 0.16; 0.15; 0.18; 0.17; 0.17 |
| 002 | - | - | 0.32 | 0.23 | 0.31 | 0.24 | 0.0 | 0.0 | 0.0 | 005; 005; 002; 002; 003; 003; 001; 010; 001; 004 | 0.26; 0.26; 0.26; 0.26; 0.25; 0.25; 0.24; 0.23; 0.23; 0.23 | 0.17; 0.17; 0.19; 0.19; 0.17; 0.16; 0.16; 0.15; 0.16; 0.17 |