Analysis of pair 1eboE_5fhcJ
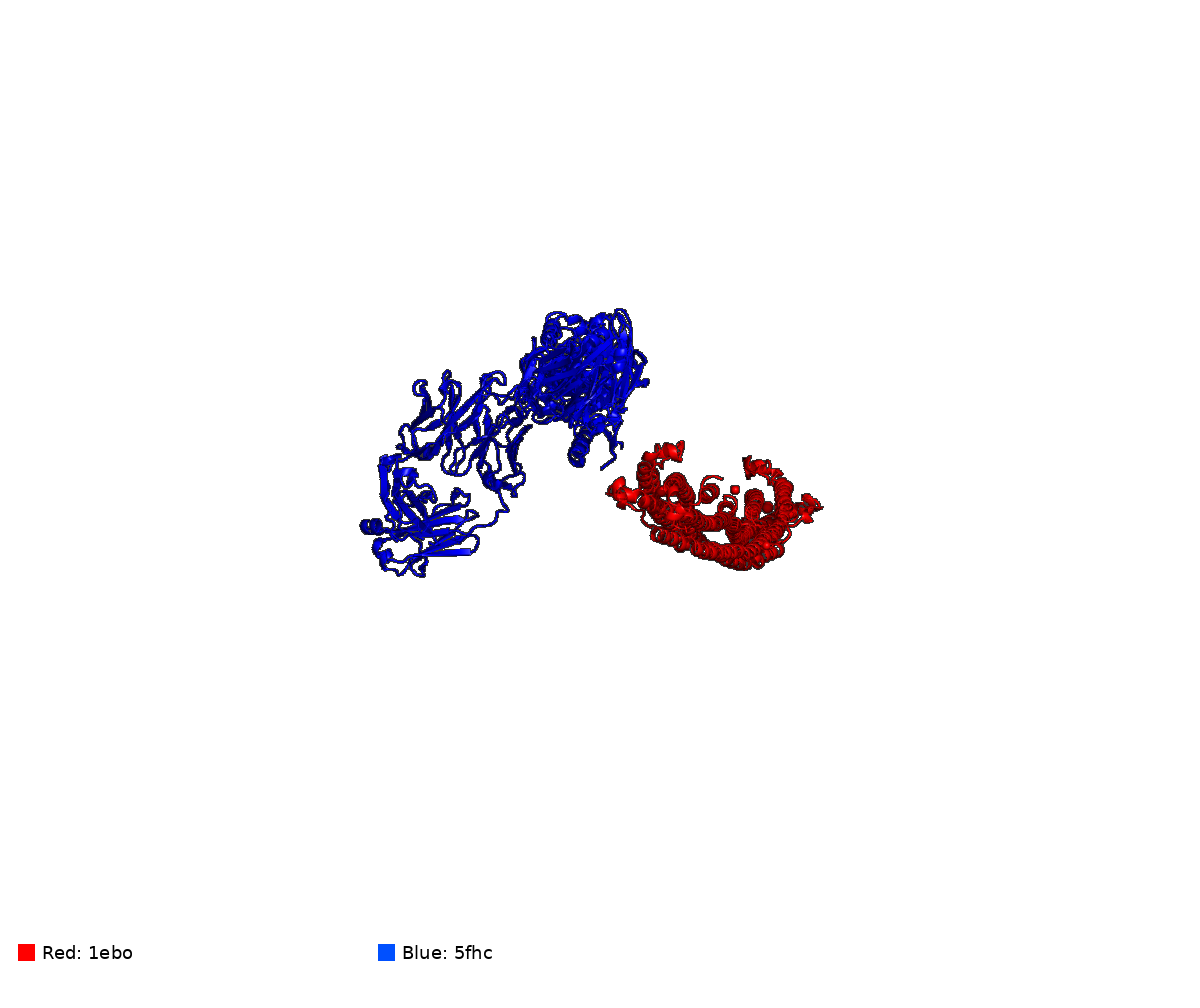
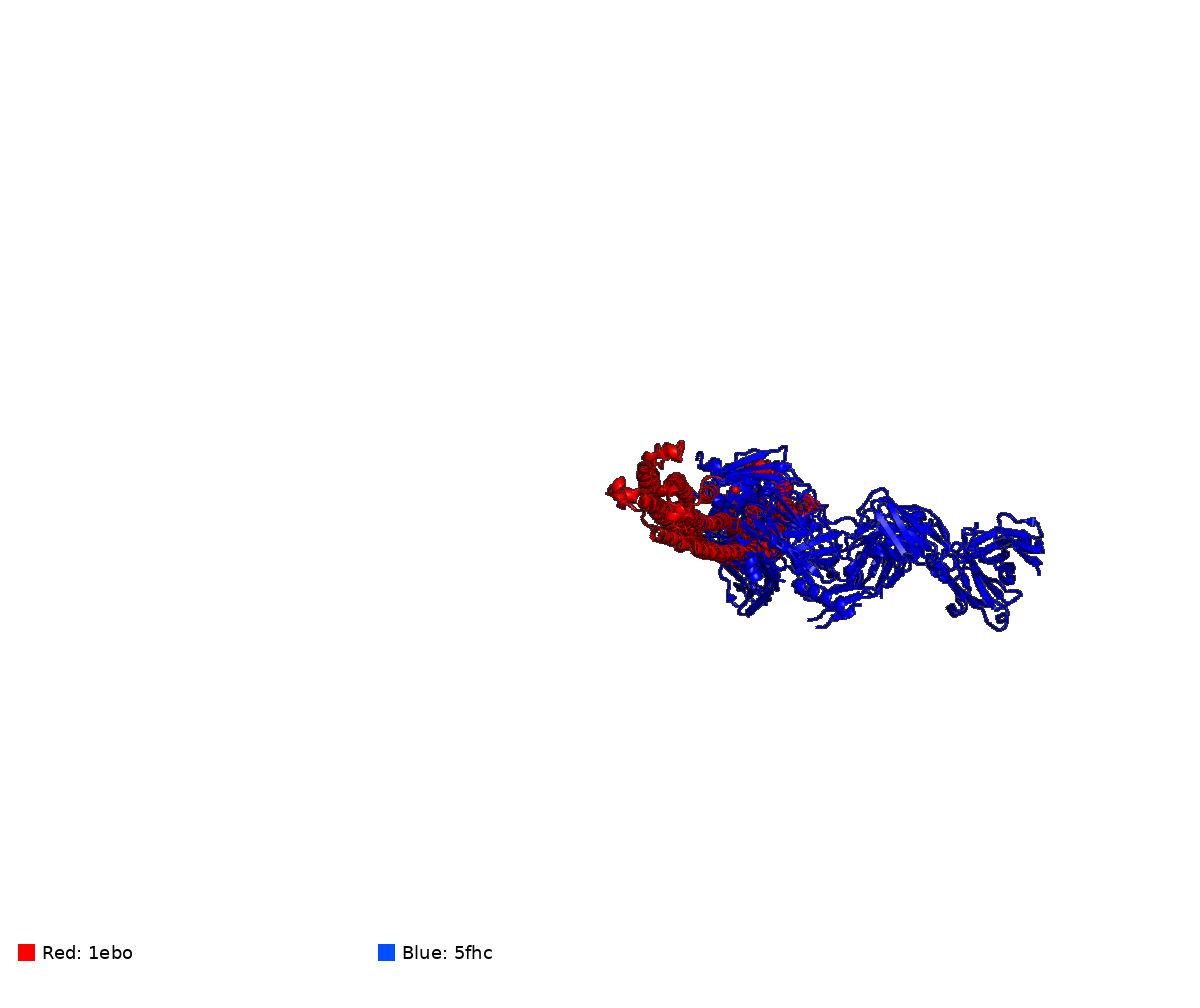
1eboE vs 5fhcJ
Missing: Fold1 vs best AF2
Missing: Fold2 vs best AF2
Missing: Fold1 vs best AF3
Missing: Fold2 vs best AF3
Missing: Fold1 vs best ESM2
Missing: Fold2 vs best ESM2
Missing: Fold1 vs best ESM3
Missing: Fold2 vs best ESM3
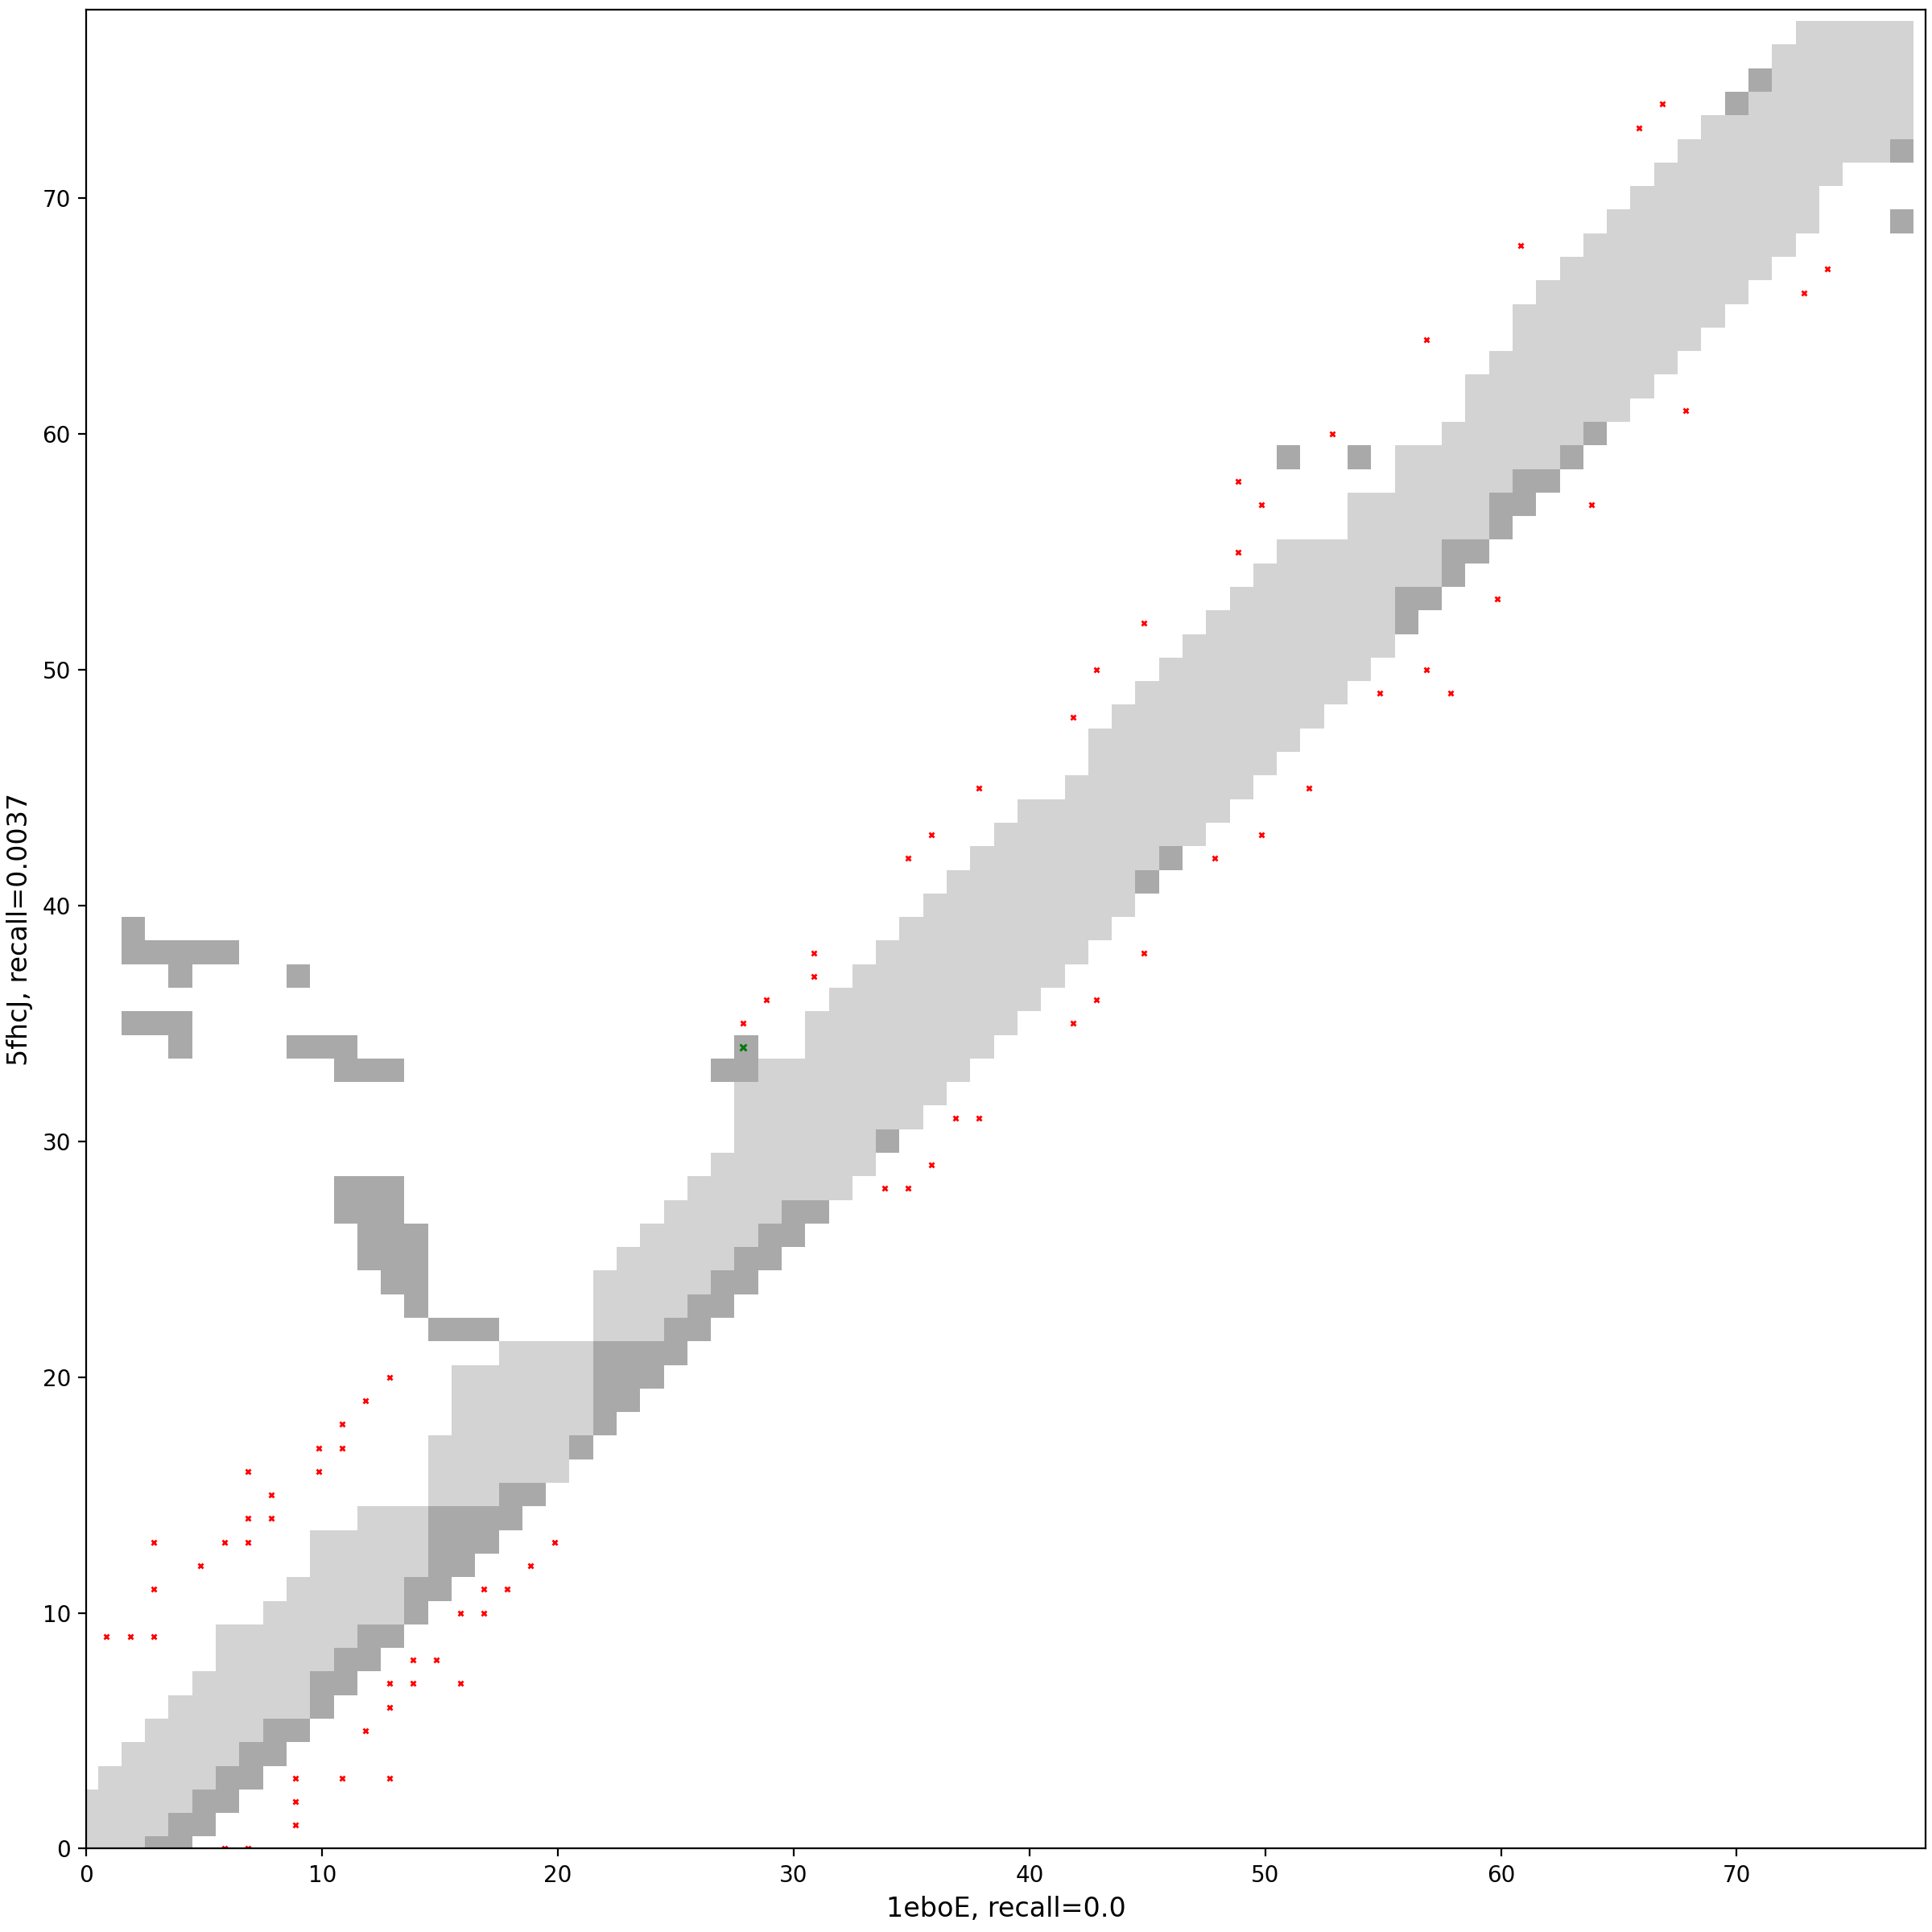
[missing] 1eboE vs. 5fhcJ (unaligned) — interactive
[missing] 1eboE vs. 5fhcJ (aligned) — interactive
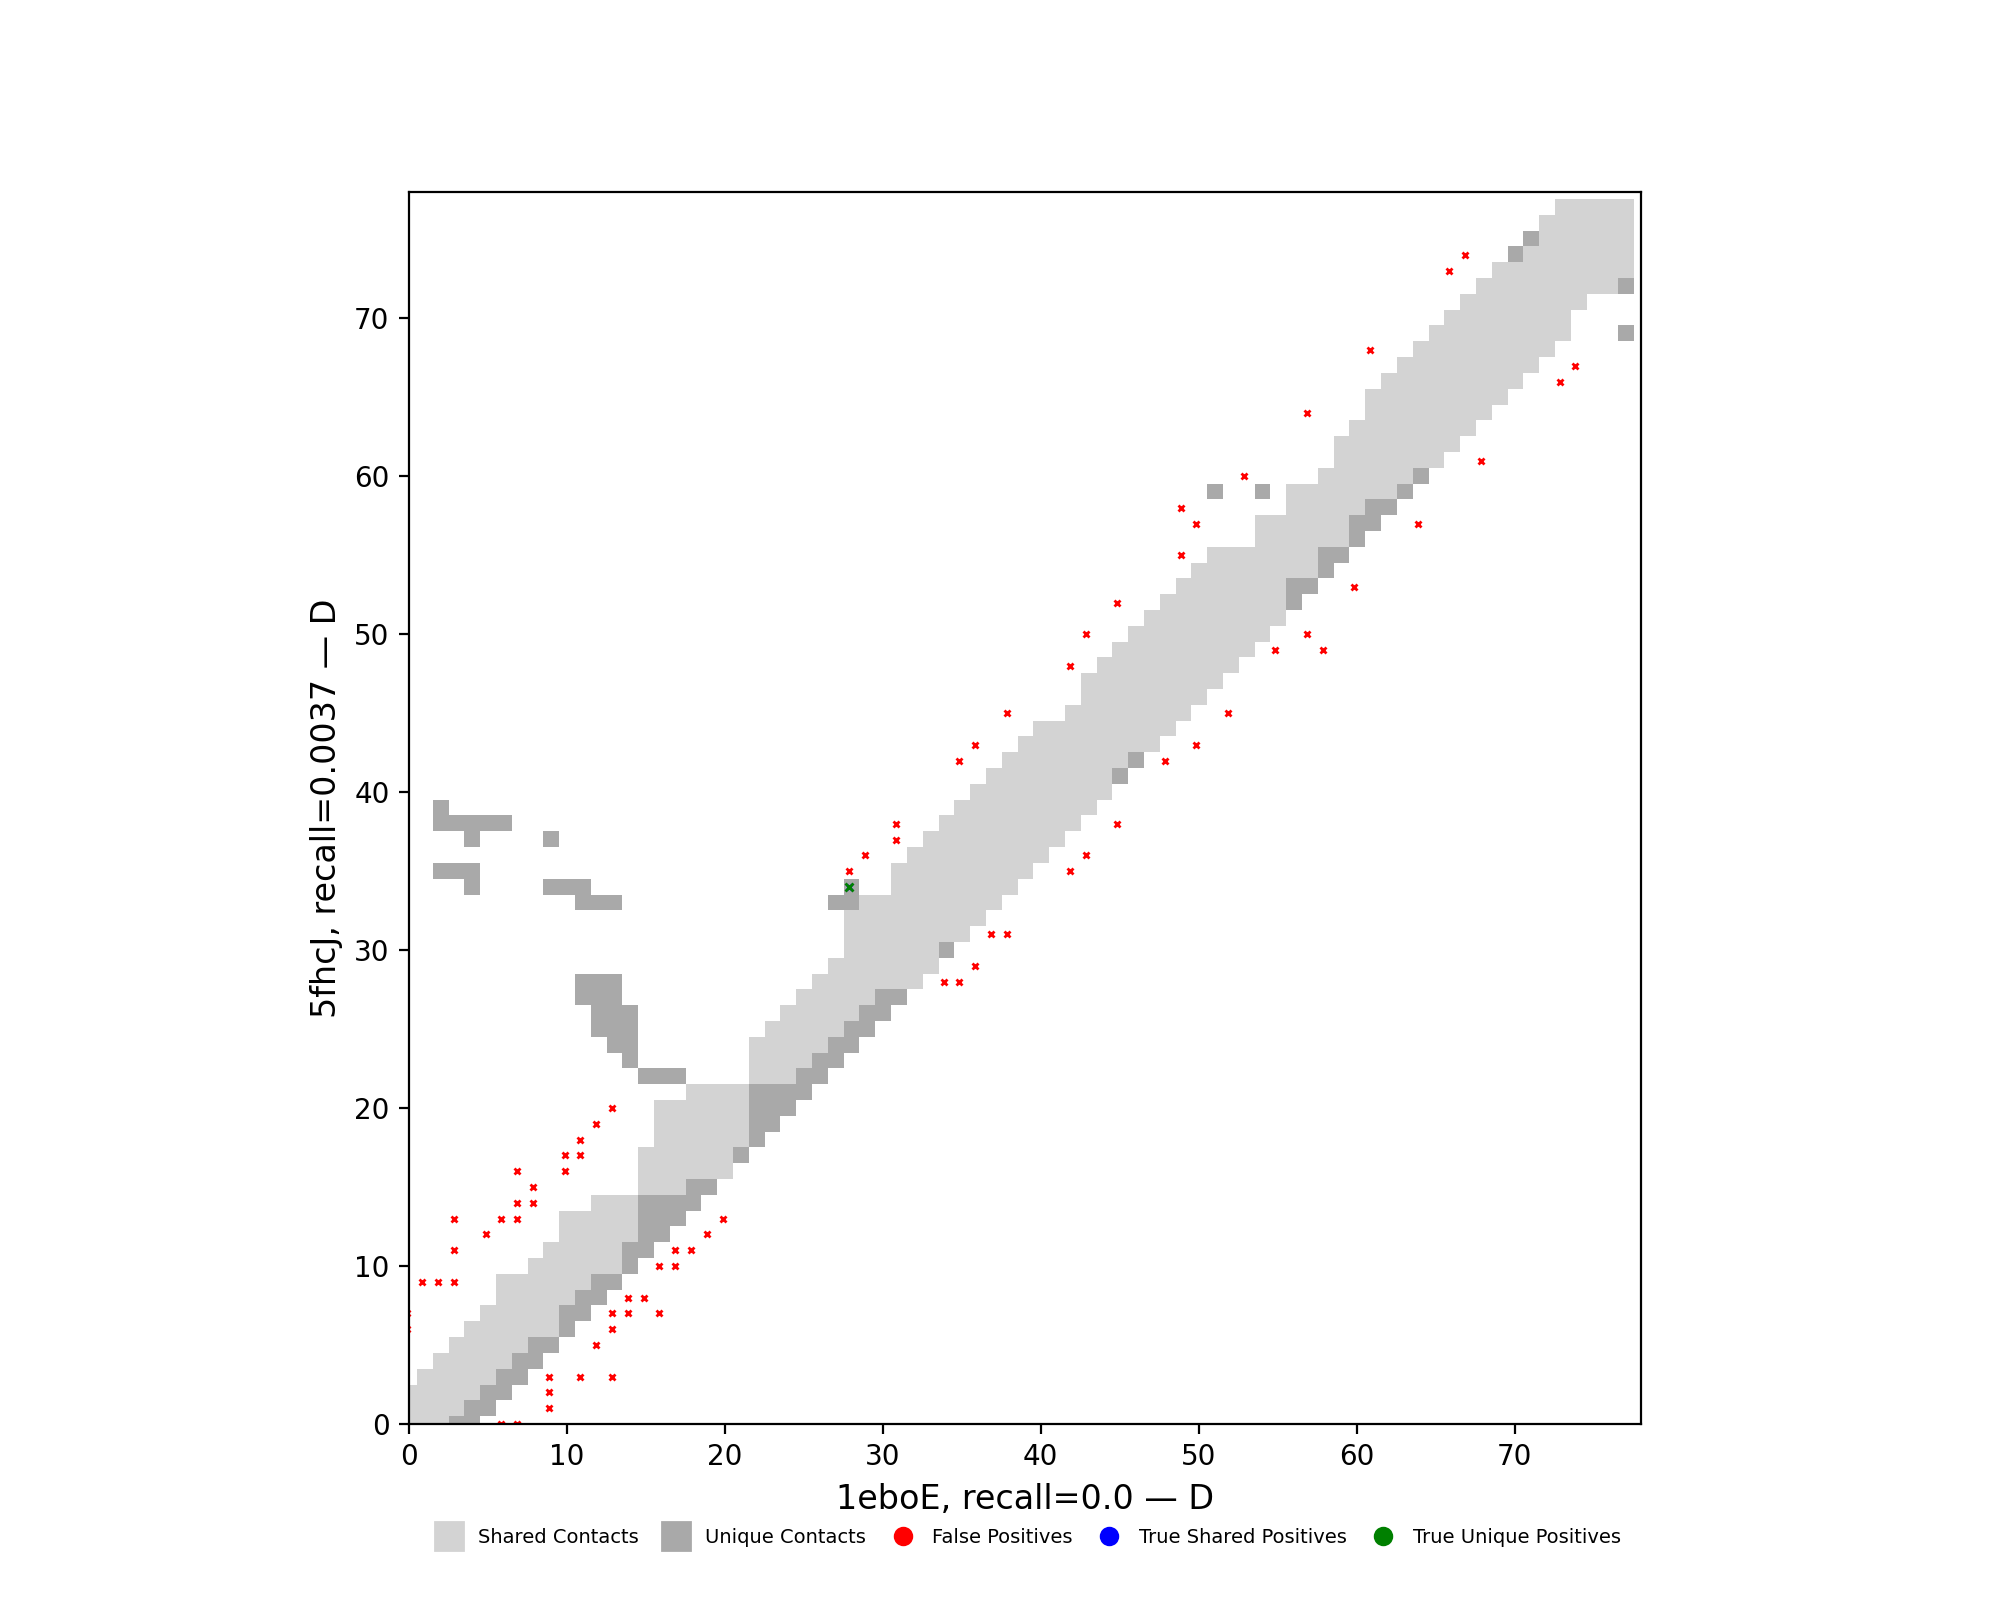
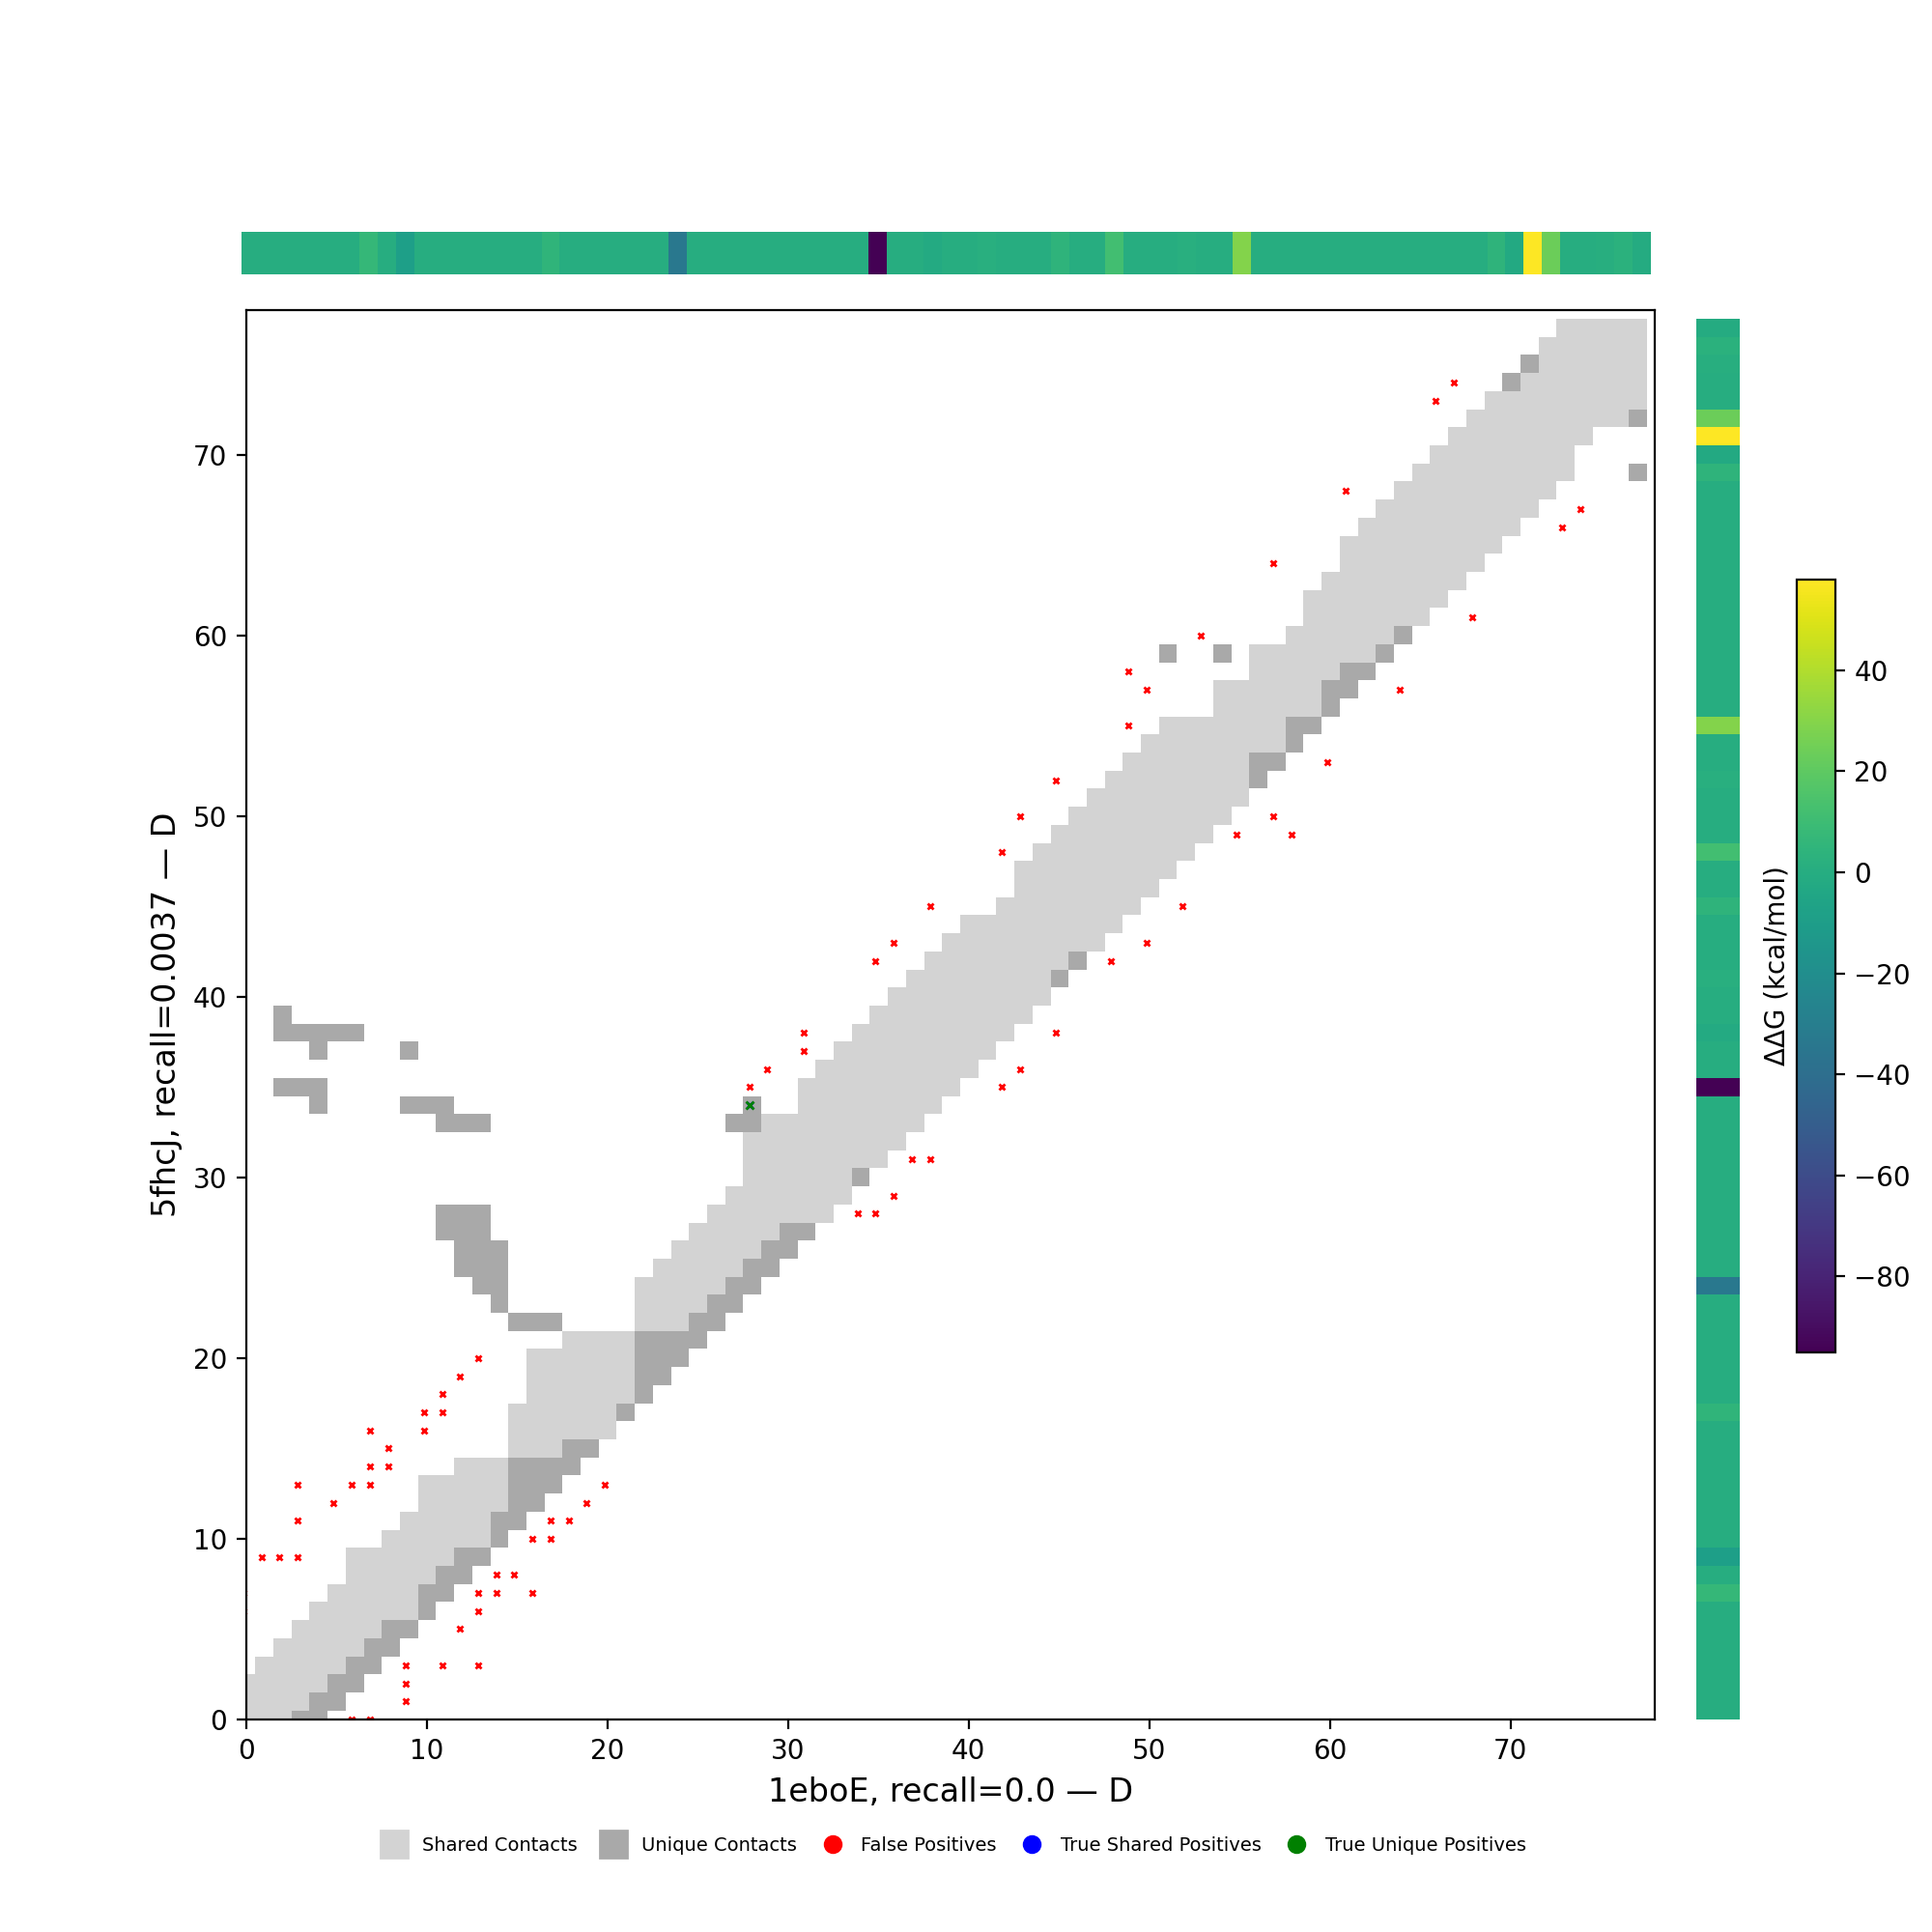
Per-cluster contact maps
Cluster metrics table
| cluster | n | neff | AF2_TM1 | AF2_TM2 | AF3_TM1 | AF3_TM2 | RE-MSAT-COM | RE-MSAT1 | RE-MSAT2 | ESM_SEQIDS | ESM_TM1_LIST | ESM_TM2_LIST |
|---|
| Deep | - | - | 0.84 | 0.59 | 0.79 | 0.27 | 0.0 | 0.0 | 0.0 | - | - | - |
| 000 | - | - | 0.84 | 0.59 | 0.8 | 0.34 | 0.0 | 0.0 | 0.0 | 001; 001; 002; 002; 003; 003; 004; 004; 005; 005 | 0.79; 0.79; 0.75; 0.75; 0.69; 0.69; 0.64; 0.64; 0.55; 0.55 | 0.25; 0.25; 0.25; 0.25; 0.26; 0.26; 0.27; 0.27; 0.23; 0.23 |
| 001 | - | - | 0.47 | 0.23 | 0.46 | 0.24 | - | - | 0.0 | 004; 004; 002; 002; 001; 001; 005; 005; 007; 006 | 0.53; 0.53; 0.47; 0.47; 0.46; 0.46; 0.42; 0.42; 0.41; 0.41 | 0.25; 0.25; 0.23; 0.23; 0.24; 0.24; 0.25; 0.25; 0.23; 0.23 |